
How to use Oracle Primavera Cloud (OPC) data for live scheduling analytics and progress tracking
Learn more about how to use Oracle Primavera Cloud (OPC) data for live scheduling insights and progress tracking by watching this on-demand construction tech demo and deep dive webinar.
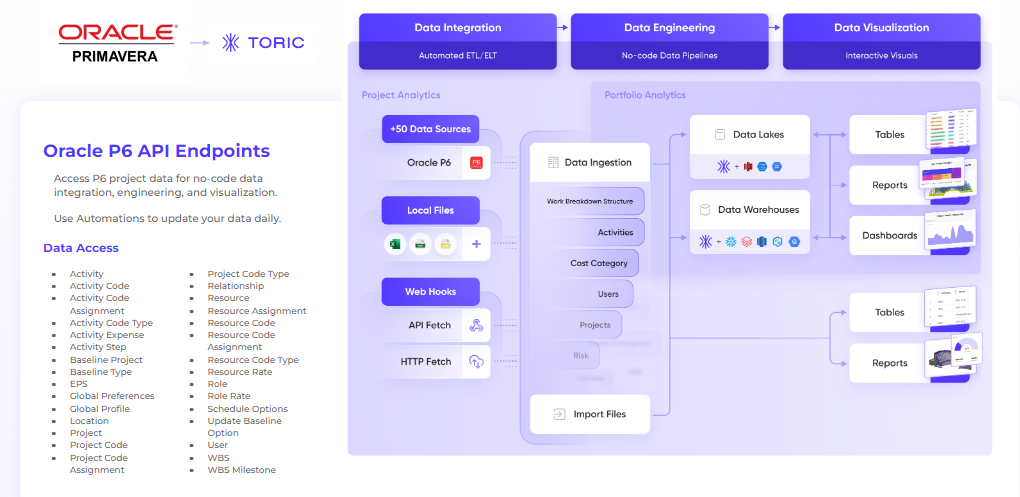
Oracle Primavera Cloud (OPC) is a popular project management software widely used in the construction industry that enables users to plan, schedule, and track project progress. By leveraging OPC data, companies can gain real-time insights, avoid scheduling issues, and improve efficiency to keep projects on track. With Toric's capability to access data from various endpoints within P6, it's now easier than ever to create real-time scheduling insights and progress tracking for better decision-making and improved efficiency in construction project management.
Many of Toric's customers, including leading General Contractor Commodore Builders, are using OPC data to build Scheduling Health Dashboards and reports with customizable KPIs, providing real-time insights into project scheduling and progress tracking.
In this tutorial, we'll use Commodore Builders as a real-world example and walk through how to use Toric to automate extracting data from Oracle Primavera Cloud, generate live schedule performance metrics, track progress against the plan, and create informative reports and dashboards to communicate progress to stakeholders.
By following this tutorial, you'll learn how to use Toric to access and analyze P6 data for better scheduling insights, avoid critical failures that cause errors, claims, or project delays, and keep your projects on track with real-time progress tracking.
Whether you're just starting or have a mature scheduling process, data analytics can help you identify and address potential issues, resulting in better scheduling and fewer project delays.
The below are requirements to start leveraging P6 data and Toric in the way demonstrated in this tutorial however, you can get started FREE with Toric using standard sources like CSVs and Excel files here.
Requirements:
- Oracle Public Cloud (OPC) account access
- Toric Enterprise plan
- Familiarity with OPC and basic knowledge of Toric
Let's get into it!
Step 1: Setup the OPC connector
A key component of Toric is the ability to connect to different data sources quickly and easily. You can access our connectors by navigating to the integrations page in the workspace's left-hand panel.
For this example, I want to configure the Oracle Primavera Cloud connector. This connector allows users to read and write data from OPC.
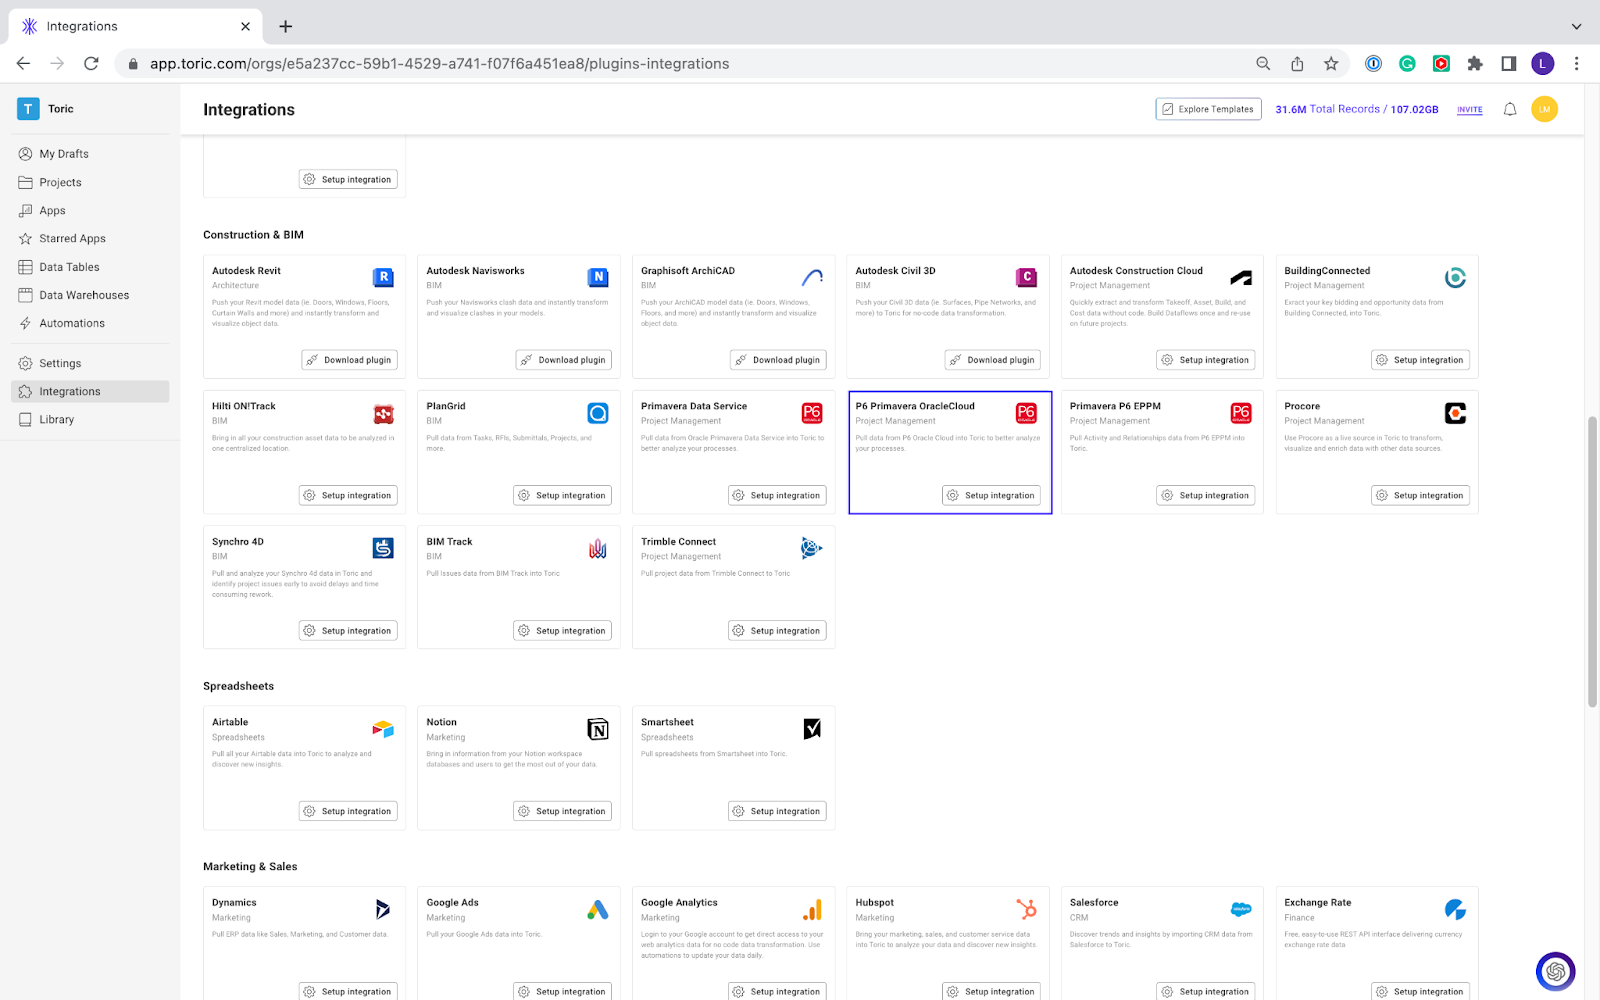
Click on setup integration. This should bring you to a page that lists the connector and any connections that have been configured. Since I previously created a configuration, I can see that listed here. Select create a connection if this is your first time setting up the OPC connector.

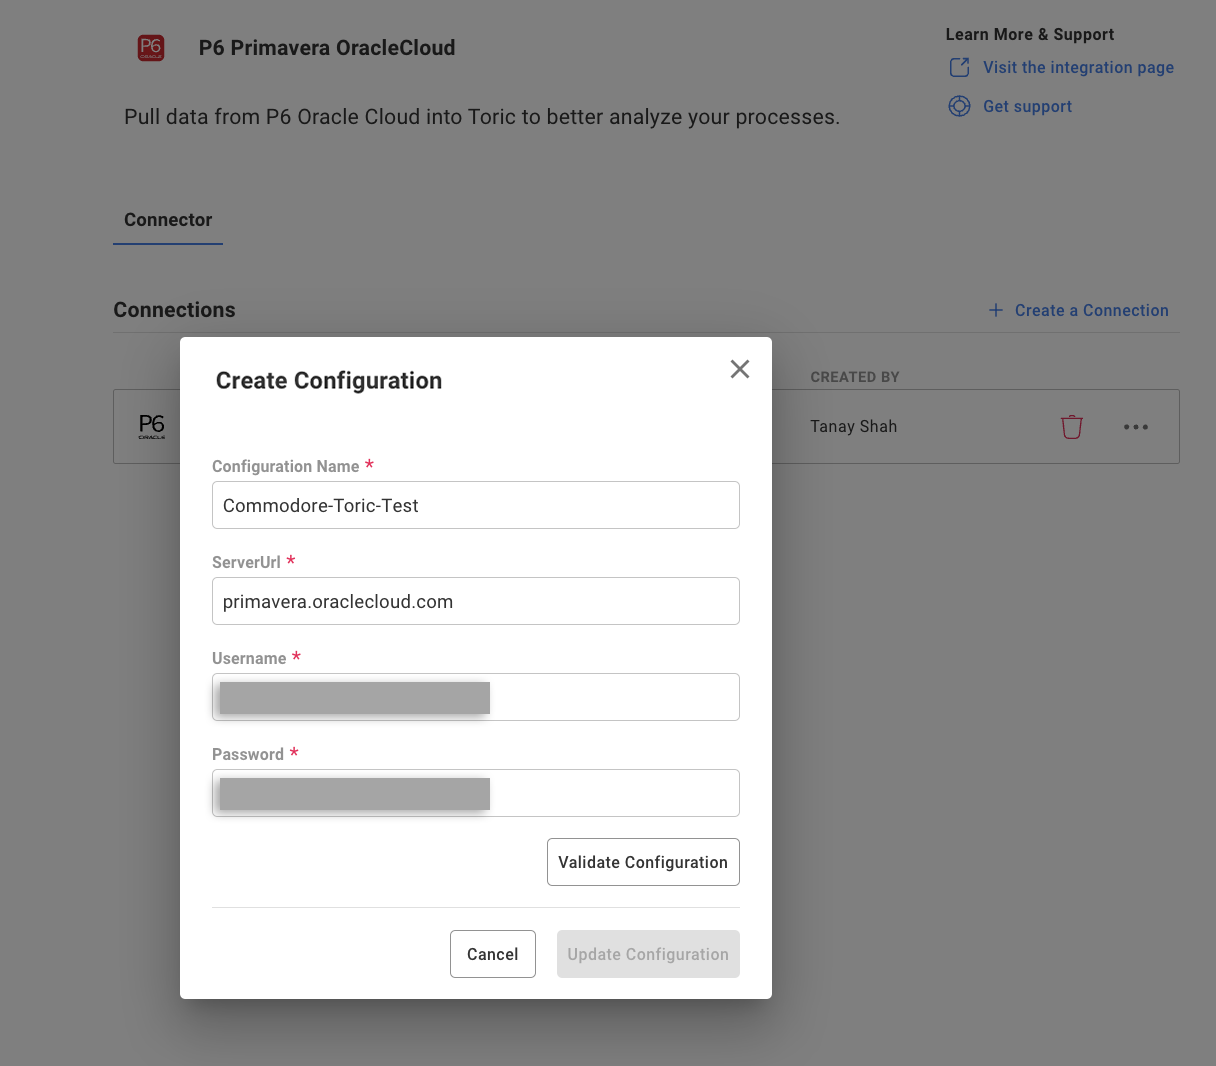
Give your configuration a name and enter primavera.oraclecloud.com in the server URL. Add in your OPC username and password. When you're ready, click validate the configuration. You will see a notification once your configuration is successful.
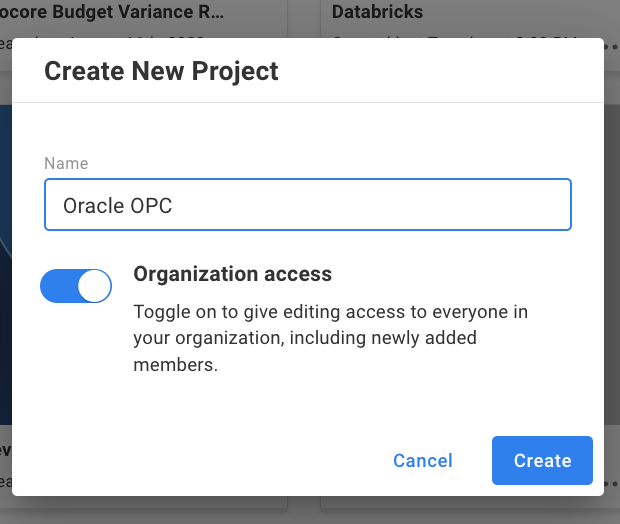
Step 2: Create a new project.
The next critical step is to create our automation, but before I do that, I first need to create a project. Projects can be found in the left-hand panel. Click on Create a Project. Give the project a name, and decide if this project is private to only the creator or share it with others in the workspace.
Now that I have my project, I'm ready to create an automation to ingest my OPC data.
Step 3: Create an automation.
There are two primary ways to ingest data into Toric with a connector:
- Manually ingest data into a flow or a project when needed for analysis.
- Automatically ingest data upon a set schedule (like every 7 hours) or based on a change event (like a source update).
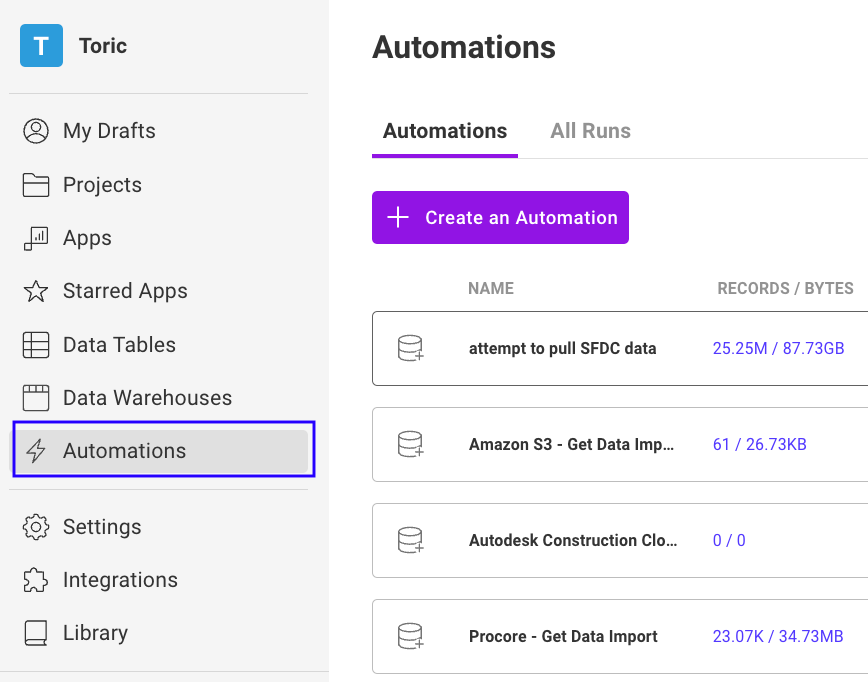
My goal in this example is to create a real-time scheduling dashboard, so I will need to create an automation. Navigate to Automation in the left-hand panel of the workspace. Once on the Automation screen, select Create Automation.
Here I will give my automation a name and description that is easy to use and reference. Next, I need to select the trigger I want for the automation. The automation trigger is what decides when an automation runs. There are four primary ways in Toric to trigger automation:

Manual trigger - The will manually run the automation once you select Create automation.
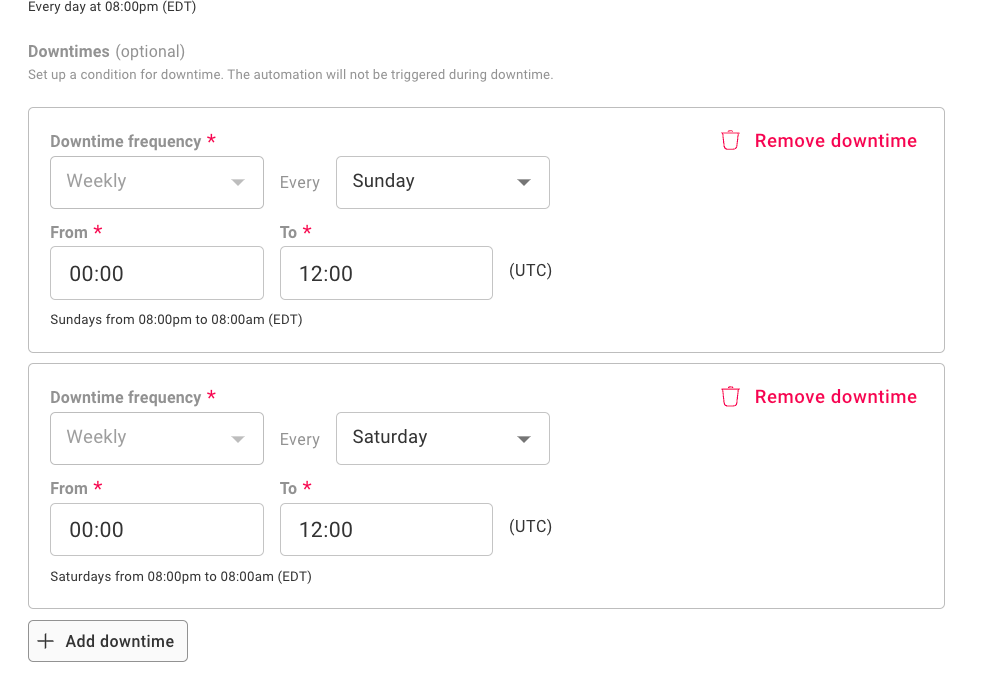
Time-based - This is used when you want to schedule an automation. Frequency options include daily, weekly, or on a time interval, like every five hours. You can add downtime to your time-based automation when needed. Say you don't want your automation to run on the weekends. You can set automation downtime to exclude automation from running during your selected time.
Source update - This will trigger an automation to run when there is a change of source type. This is particularly useful to trigger data ingestion when a source file has been updated. You can use automation this way to automatically trigger flows and apply your data engineering to re-ingested data.
Webhook - This will trigger ingestion when a webhook is triggered. Webhooks are going to apply to specific connectors. For example, we can ingest data from some Procore endpoints, and our users leverage this form of automation to trigger a Toric automation every time a change is made in Procore.
Select the automation configuration that works best for your use case. For this example, I recommend using a time-based trigger set hourly, webhook, or source update trigger type to achieve real-time data. I will set this to manual to trigger the automation myself and show you how it works.
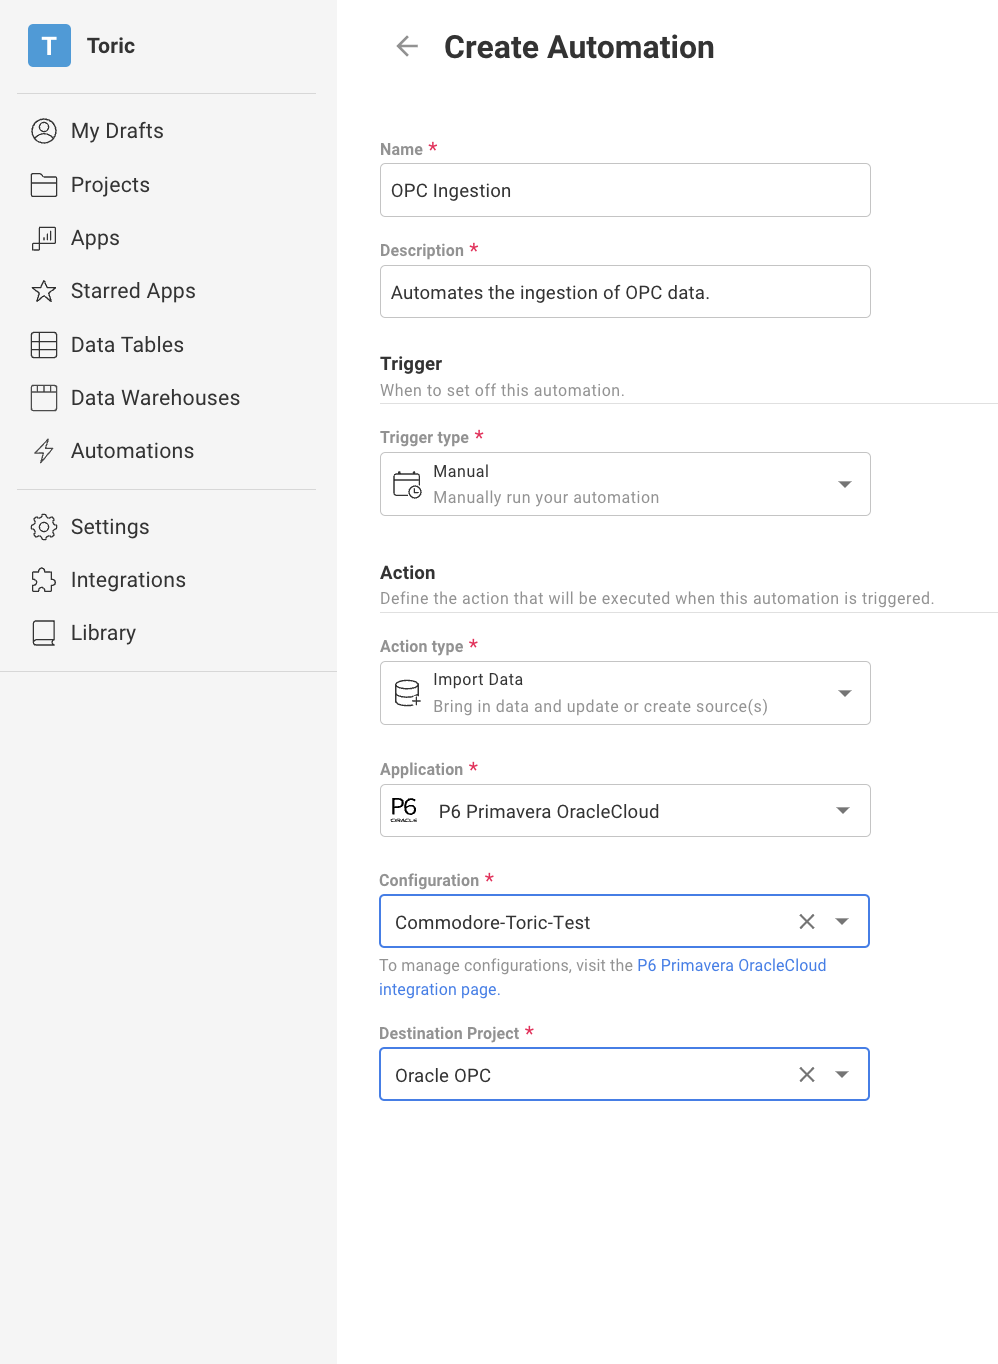
Now I need to determine what I want the automation to do, and for this example, I want to ingest data from OPC. I will set my action type to import data, select P6 Primavera OracleCloud as my application, and select the configuration I just created. Lastly, I want to select the destination project I created earlier for this ingestion.
This automation will now ingest OPC data on an hourly interval.
Next, I want to walk through what happens when an automation is triggered. When I select Create automation, my automation will run since I set the trigger to Manual.
Step 4: Using your OPC data.
Now I need to navigate to the project I selected as the destination for my ingested data. The automation I ran automatically created a new source node when the OPC data was ingested into my project.
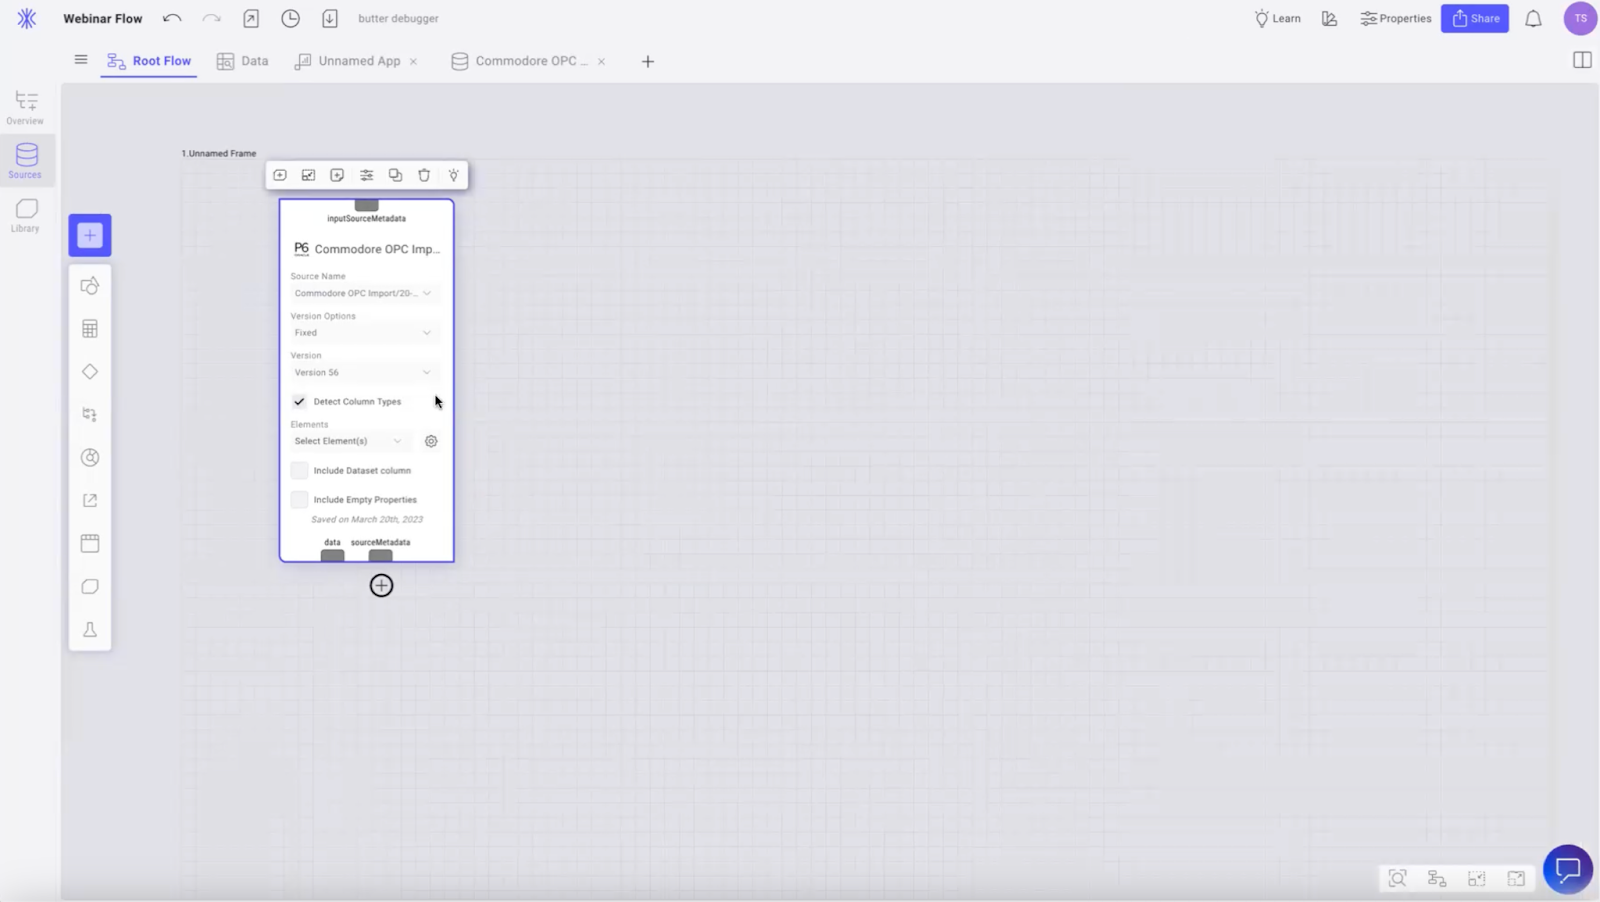
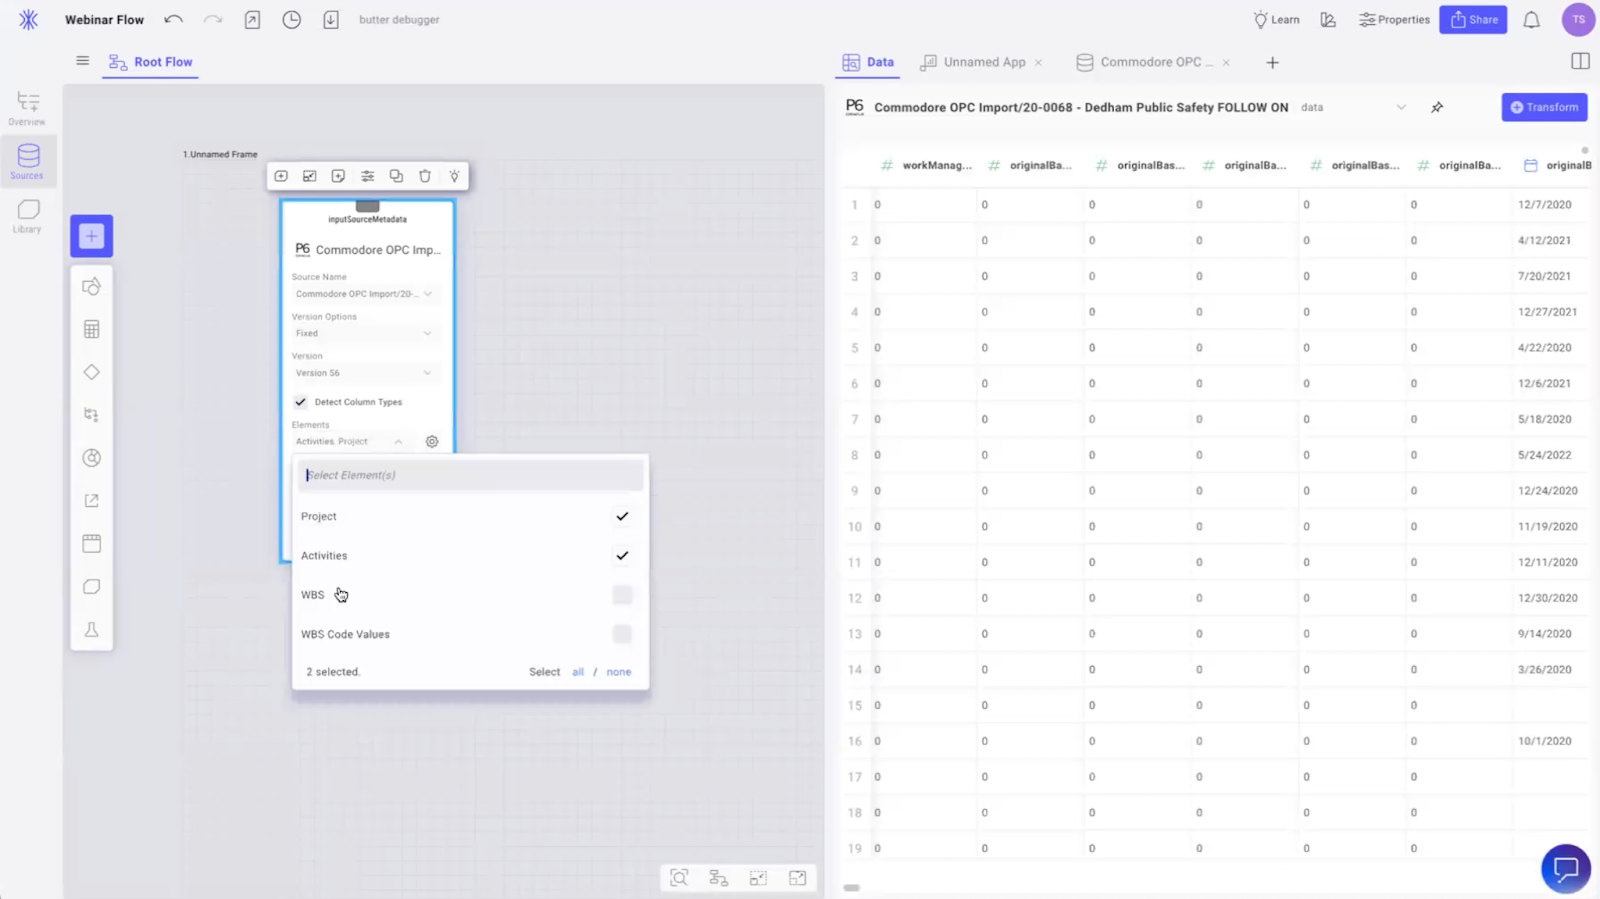
With this new source node, I can now view the data within my flow. I can see in this node that I can select specific elements. This allows me to only use the elements I select here within my data flow.
For this specific example, I can select activities and projects to analyze datasets and drill into my data to answer questions like how much actual activity happened this week? What is my overall project percentage complete? What is my schedule duration variance for all projects?
When in the workspace, I recommend using the split view workspace to see your data within an interactive table, making it easier to visualize and see changes as you make them.
Step 5: Begin your transformation.
Now that your source node and elements are selected, you can begin your data engineering in Toric. In Toric, data engineering is done through Nodes. A node typically refers to a processing unit or a step in a data pipeline that performs a specific operation on the data. It takes inputs, and produces outputs.
Nodes can be thought of as building blocks that are used to create complex data analytics workflows. These workflows might involve tasks such as data cleaning, transformation, analysis, modeling, and visualization.
The nodes you should use in your transformation to achieve the same results as Commodore could include:
- Join
- Breakout
- Filter
- Columns - Rename, reorder, combine, change type
- Summarize
- Diff
- Coalesce
- Sort
- Pivot
- Find and replace
You can also perform a number of calculations like sum, add, subtract, count, or field calculator.
View our courses to get started with data engineering in Toric, or check out our recent blog covering all the engineering capabilities our workspace provides.
Step 6: Create your report.
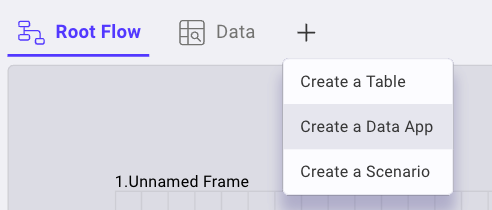
Creating reports in Toric is simple and easy. Click on the plug button at the top navigation in your graph and select a new Data App. You will now see a blank canvas. I highly recommend using the split view workspace so you can have your root flow in the left panel and visuals in the right.
To start creating a report, click the add button and select the components you want to include.
With this visual canvas, you can create fast, responsive, and adaptive rich tables and charts. You can add images, descriptions, modify background colors, padding, and drop shadows. You can add interactive elements like sliders, filters, dropdowns, cross highlights, and toggles. Our users have created hundreds of reports and dashboards using these visual components, and they are specifically designed to allow you to add your own branding.
For this scheduling dashboard, some of the metrics you might consider including are:
- Critical vs. Overall Activities
- Duration Variance
- Performance indexing
- Overall Project Activity Percentage Complete

Get started with Toric
I hope you enjoyed this tutorial on using Toric to create actionable scheduling insights from your P6 data. You can learn more about our Oracle Primavera connector here and see more about the benefits of Toric for scheduling analytics by watching our on-demand webinar with Commodore Builders here.
If you haven't already, we encourage you to sign up for a free account and start exploring the workspace with course videos. With Toric, you can easily visualize your project and business data and derive insights that can drive better decision-making.
And if you need any help getting started, don't hesitate to request a demo with our team to learn more about how Toric can help you manage your projects more efficiently. Try out Toric for free today and see for yourself the power of our all-in-one data analytics workspace!
.png)


.png)


