
How to use Revit Data to perform Cost Estimation Analytics and Quantity Takeoff
Learn more about how to perform cost analytics & quantity takeoff by watching this on-demand construction tech demo and deep dive webinar.
What is Quantity Takeoff?
Before we jump into the tutorial, we want to briefly explain Quantity Takeoff, which is a better-detailed measurement of materials and labor needed to complete a project for cost estimation analytics during preconstruction. Quantity Takeoff or QTO can be performed based on your existing BIM Model(s) created in tools like Revit that contain all of your detailed building information (ie. Doors, Windows, Floors, Curtain Walls, and more).
You can view templates to see example data visualizations using Revit that help you get a quick breakdown of building materials for everything from Steel Tonnage to all your Architecture quantities. Blend Revit data with other sources like CSVs to keep track of your project costs before and during construction for 5D Cost Control. Or, perform Health Checks and Model Audits to analyze element changes from two versions of a Revit model, allowing you to track the design evolution of a project and quantify changes.
What is Revit?
Revit is one of the most widely used software applications for BIM modeling in the construction industry. It allows architects, engineers, and construction professionals to create detailed 3D models of their projects, which helps them visualize potential design issues early in the process. Revit is excellent for this use case because it automatically generates the information we need to perform a quantity takeoff.
For this tutorial, I use a 10-story, 320,000 sqft resort and a series of two-story villas totaling 100,000 sqft. This model is at a schematic design level of resolution where initial cost estimation and quantity takeoff would typically begin, making it an accurate model and a good example for this tutorial.
This model's element types are populated with measurement rates and uni-class codes, aligned and coalesced in Toric with a cost rates table in Excel format. This is a standard format for cost estimators to still use for cost rates; however, they usually manually resolve quantities against these and can only sometimes drill down by level, zone, building, etc. Toric enables more profound insight into the calculations and enables these two data sources to generate these calculations based on modeled quantities.

Now that we understand our Revit model let's learn a little about Toric.
What is Toric?
Toric is a data analytics workspace that hooks into all of your data sources for analytics and is a fast and cost-effective way to turn data into insights in near real-time dashboards and reports without writing any code. Watch this 4-Minute "Who We Are" video to learn more.
Toric provides ready-to-deploy data connectors to industry-standard software like Revit, Autodesk Construction Cloud, Procore, and Oracle Primavera P6. It is a fast and efficient way to check the performance of your Revit files and allows you to run a model audit or “health check” without installing any software locally. Toric users can quickly analyze and optimize Revit models for performance, stability, and accuracy.
With Toric, you eliminate the manual processes it takes to export and import Revit data and open the door to ingestion automation, like re-ingesting a model when there is a change or on a specific timely basis (like every five hours or once a day).
Before we open Toric or Revit, one important question we must answer is how we measure our objects. Typically cost estimators on projects coordinate a cost data table which we share via SharePoint, so it is live data. We'll update this data table with our model's items, leaving columns blank. I'll need to measure the object in Revit to correct that field with the cost of the object. Typically, I will work with classification codes because it helps the cost estimator work more broadly across the data I provide.
Our first problem with this process is that our data table from the estimator is in Excel, not Revit, and there could be double handling a lot of data in this process. I will use Toric to intersect these data sources and focus on trying to get this piece of data from the cost estimators table to connect with this piece of data from the Revit model on a live, repeatable, and scalable basis.
Now, let's get into the tutorial.
Before we open Toric or Revit, one important question we need to answer is how do we measure this object? Typically cost estimators on projects coordinate a cost data table which we usually share via SharePoint, so it is live data.
Generally, we'll update this data table with our model's items, and we usually leave columns blank. I'll need to measure the object so we can correct that field with the cost of the object. Typically, I will work with classification codes because it helps the cost estimator work more broadly across the data that I provide.
Our first problem with this process is that our data table from the estimator is in Excel, not Revit, and we could be double handling a lot of data in this process. I will use Toric to intersect these data sources and focus on trying to get this piece of data from the cost estimators table to connect with this piece of data from the Revet model on a live, repeatable, and scalable basis.
Step 1: Create a Data Flow and add sources
Make a new Project and Flow. This is my canvas to build a tool to integrate, manage, and visualize my data. I can set up variable data sources so I can use my data flow for more than one mode to support multiple active projects in an organization.
Now I want to add my sources. I'll be using my Revit model as a source. BIM360 is another 3D BIM tool supported by a Toric data connector.

Once you add your data source, it will create a new node in your Flow. We will start our data workflow downstream from this source node.
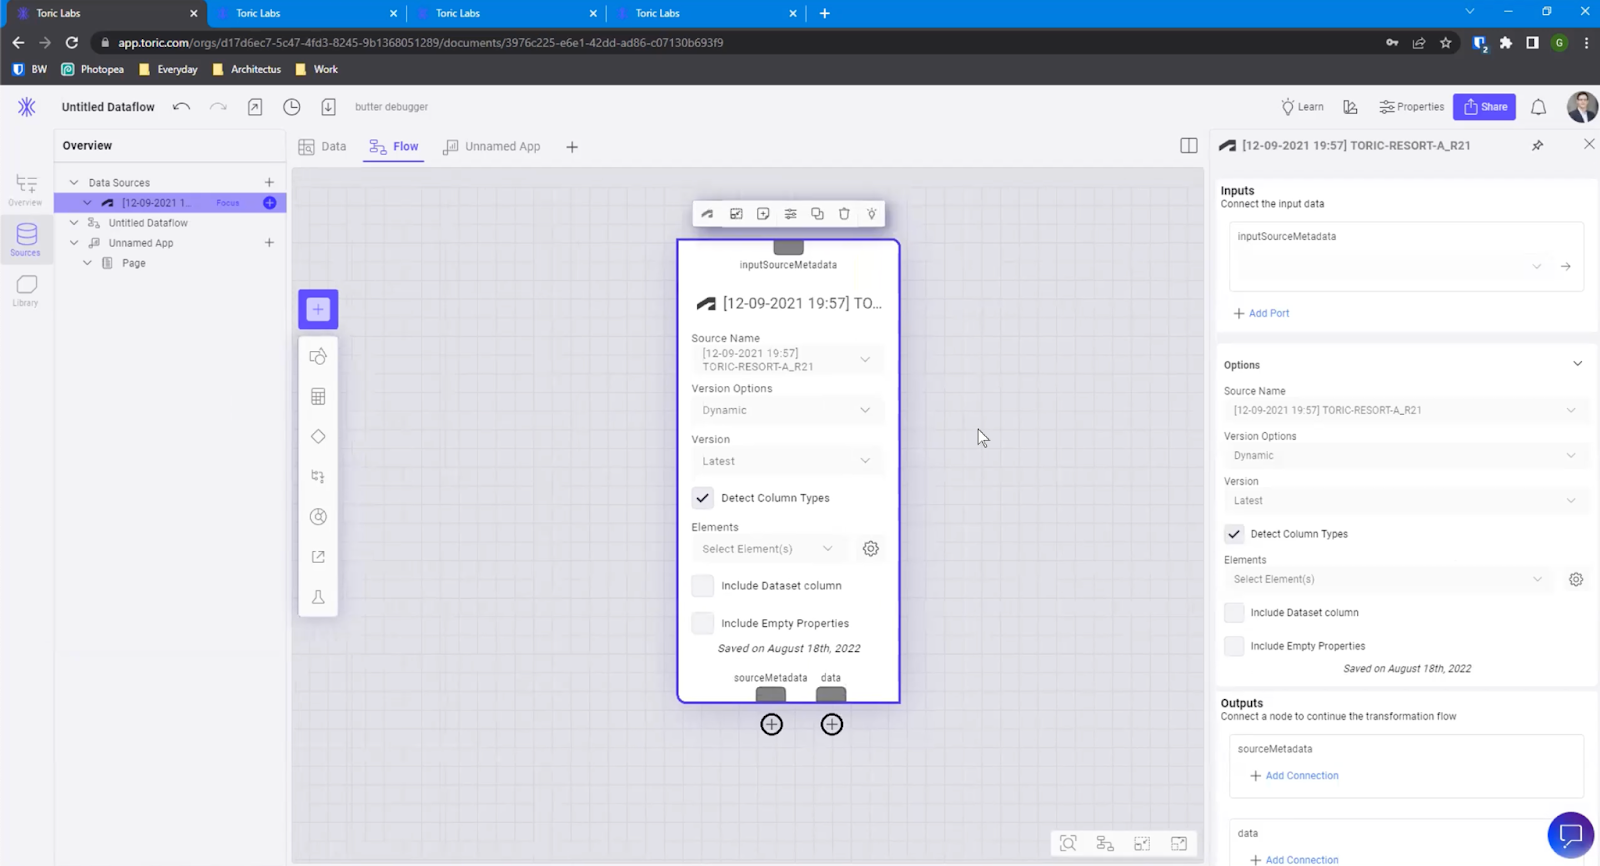
Toric is built for the Architecture, Engineering, Construction, and Operations (AECO) industry and to work with our data sources, so we have features like category recognition built in so I can start isolating objects like walls.
Step 2: Begin the QTO Data Flow
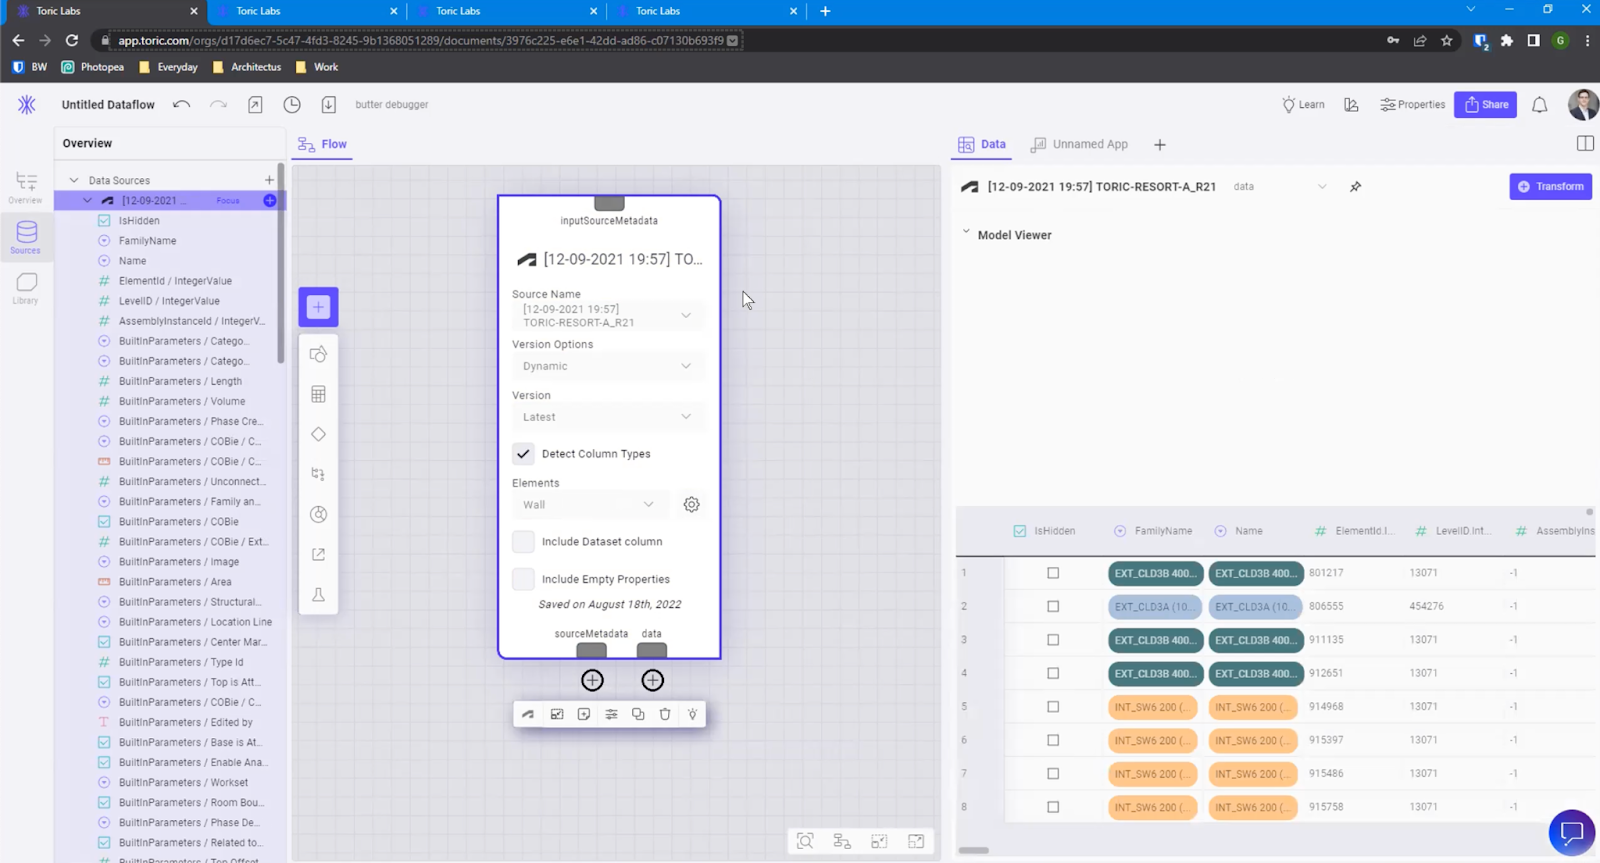
Let's start with a basic QTO of the walls in this model. In the source node, under Elements, select Walls.
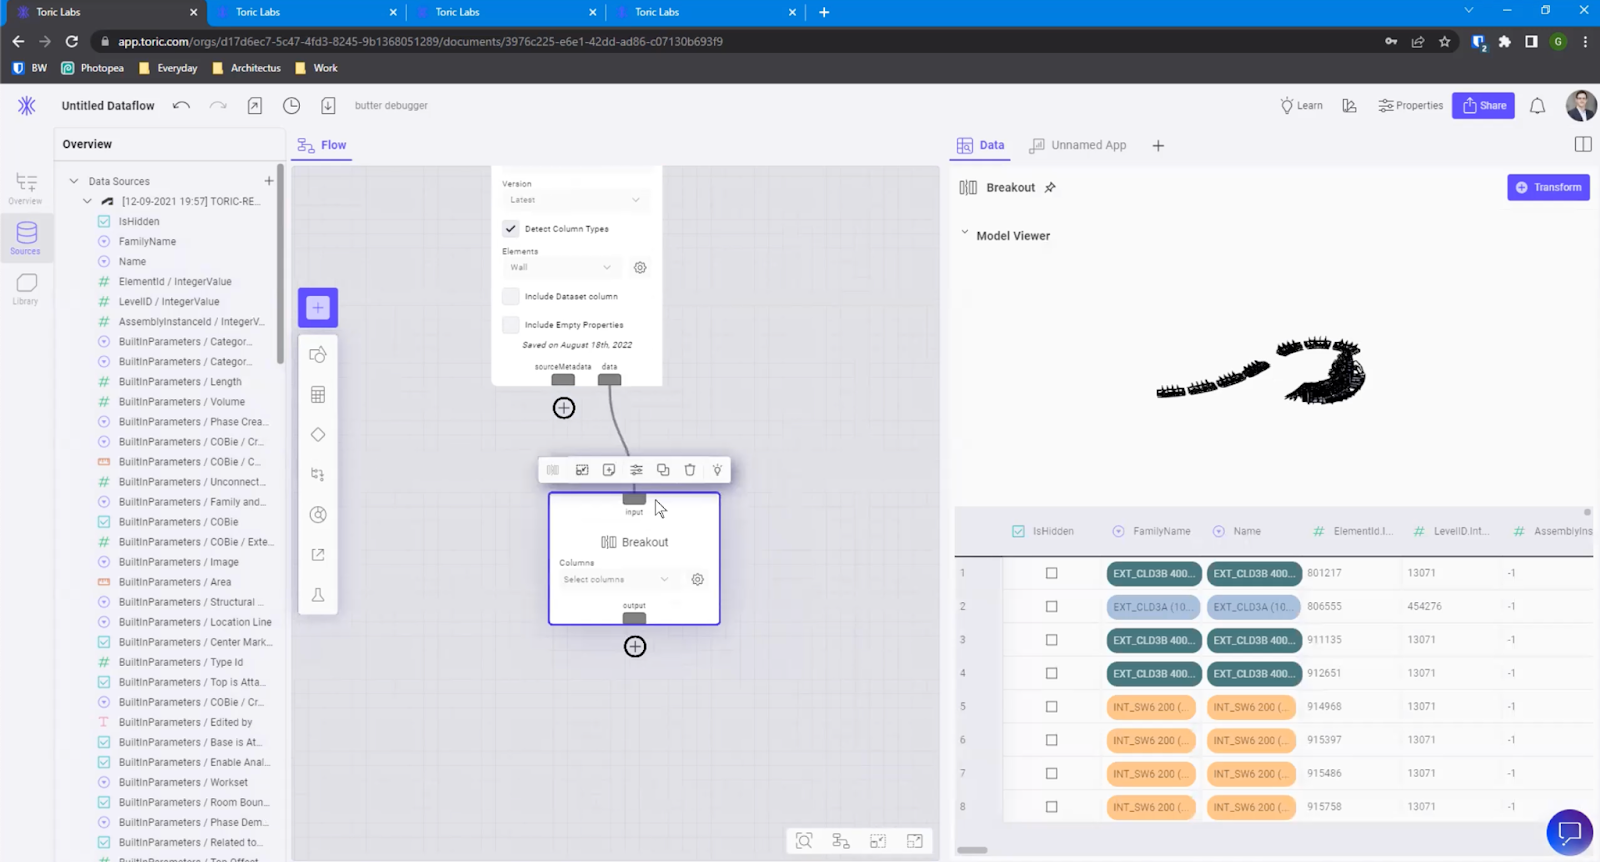
Now I am going to filter down my data using other nodes. Click or drag the Plus icon from the source node to create a new node. Search for Breakout. This will allow me to start filtering specific columns of my data.
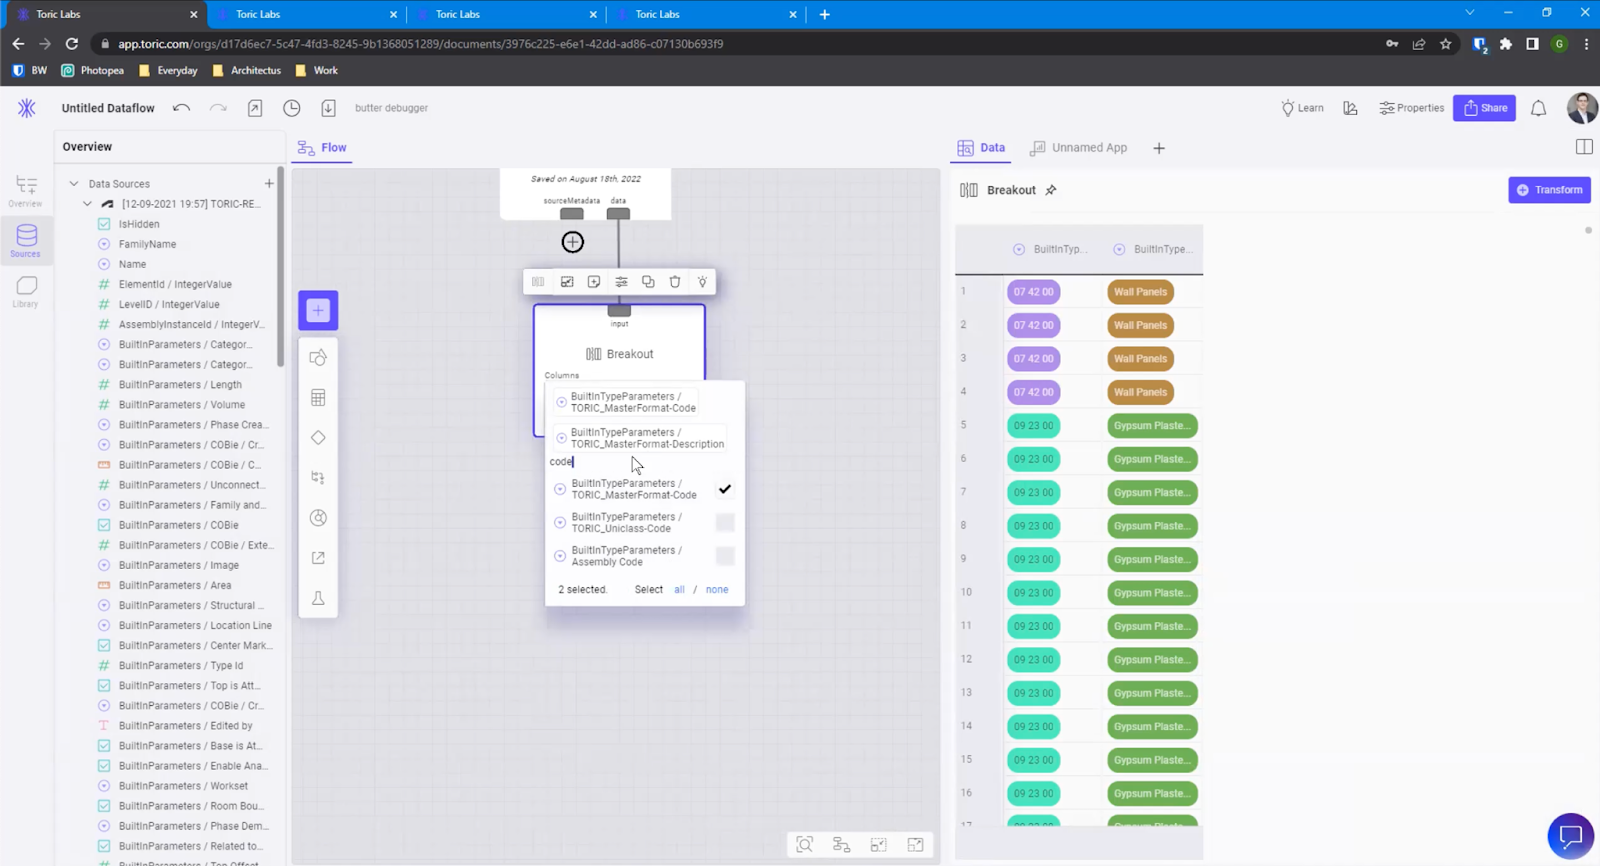
Now I can target particular fields, so Toric will show me all my available data if I start searching. I can see my master format, cost code, and description. Toric makes it really clear what parameters are coming from the model and what they are.
Step 3: Add data sources
Now I need to add my other data source, the cost table from Excel. Here I will repeat step one and select my Excel file.

Excel sources will have different options in the source node. One worth calling out is connecting to my Excel sheet as fixed or dynamic versions. This feature allows you to pull the data in your sheet from a particular date in time or connect to the most up-to-date version.
You'll immediately see a data table with the column types automatically detected by Toric. This is a key feature to utilize when connecting to your data sources to successfully create the unit types and even multi-select fields, enabling us to create dropdowns and filters to interact with our data later on.
Step 4: Join data sources
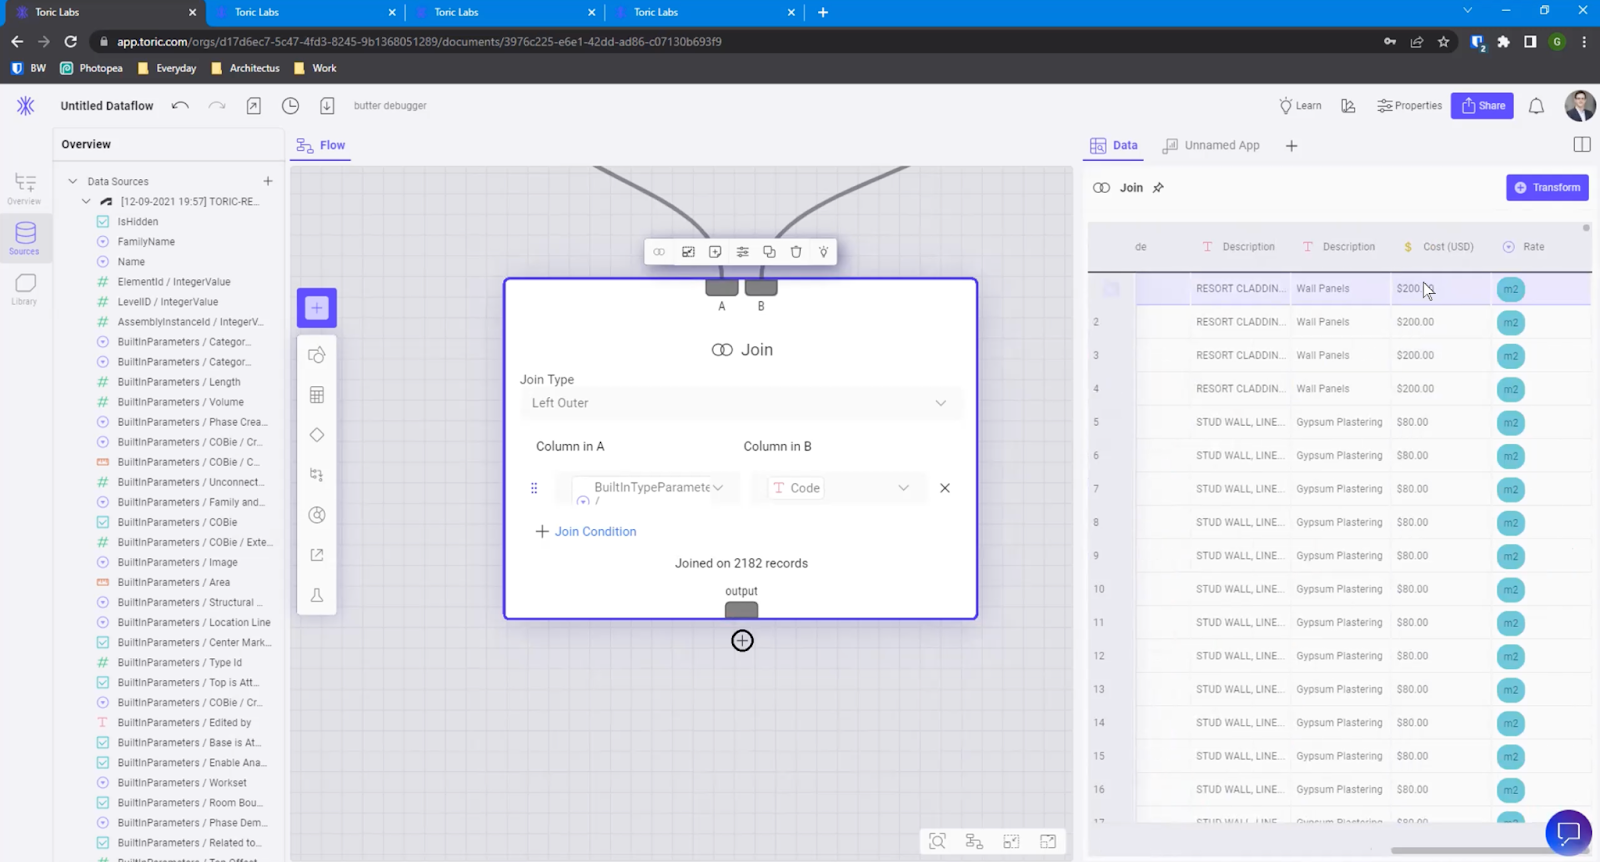
Create a new Join node and connect your Breakout node from the Revit source node to your Excel source note.

I will use a left outer join, which means the data coming in from source A on the left will set the order in which the data is joined. In this case, I am looking for a master format code in the Revit model. This appends the matching rates, similar to a V look-up in Excel by matching the codes to the relevant area in my model. By doing this step, we have effectively joined our cost data with our model.
Step 5: Add in calculations
With my sources now joined, I can start adding in calculations.
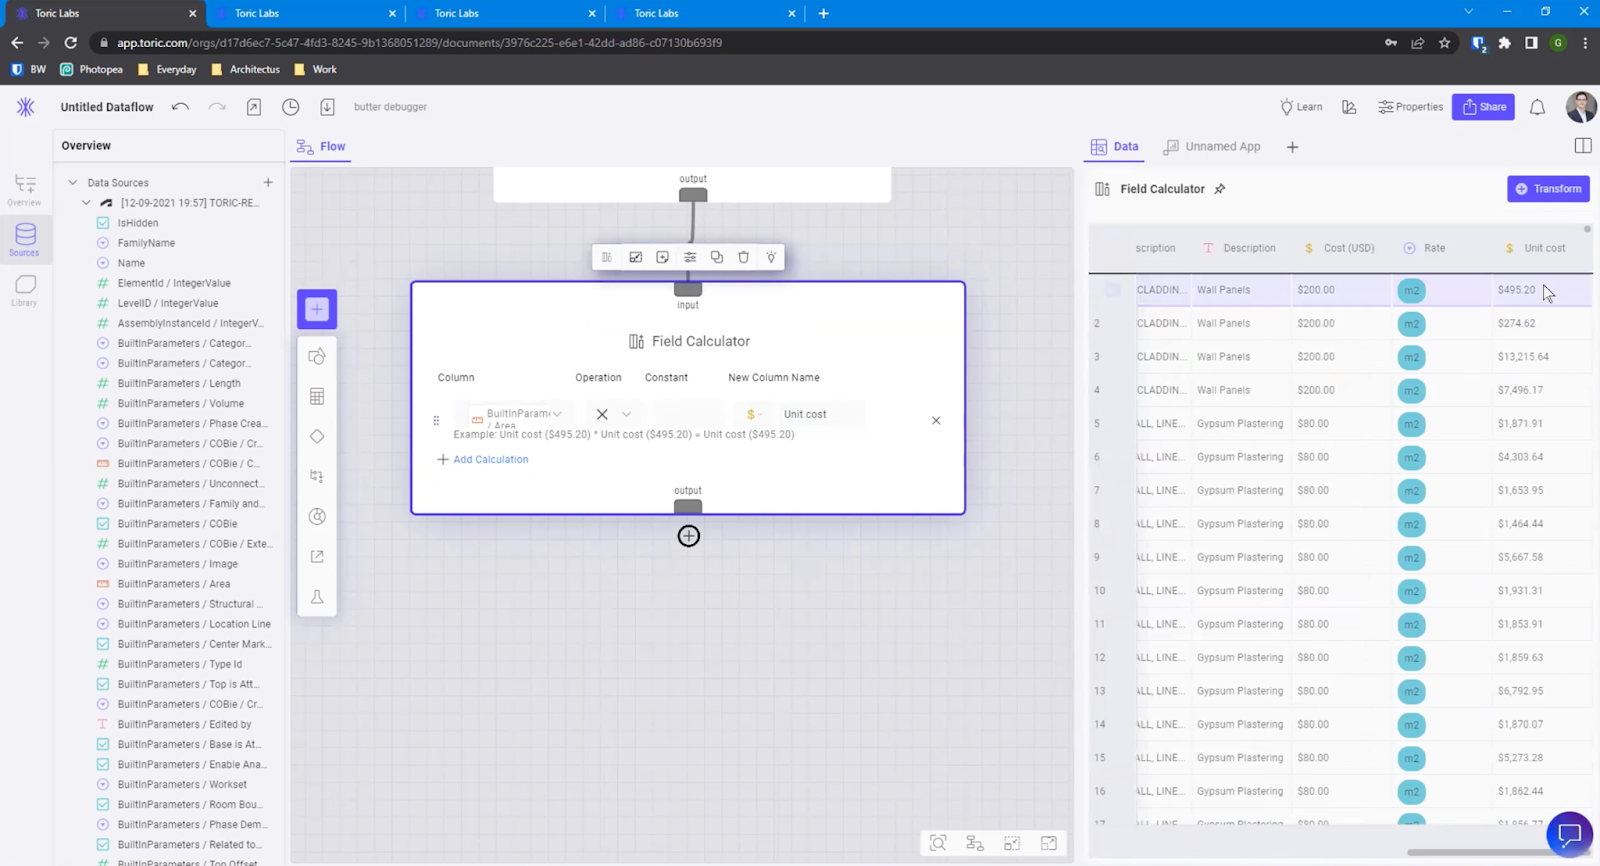
Here I will add a Field Calculator node to take particular fields and generate new columns based on interactions between other columns. This is similar to what can be done in Excel, but instead of creating a column and writing the formula manually, I am now just creating a new node.
Now I can multiply my area and cost in the same table and give the new column a name and separate data type. For this example, I want the new data type to be currency.
Toric successfully automated a calculation applied to these two pieces of data coming from two different data sources. I can now see that this is my unit cost of the object.
Step 6: Begin data cleansing
At this point, you are halfway through the process. Now we need to start cleaning up our data so it's suitable for visualization.
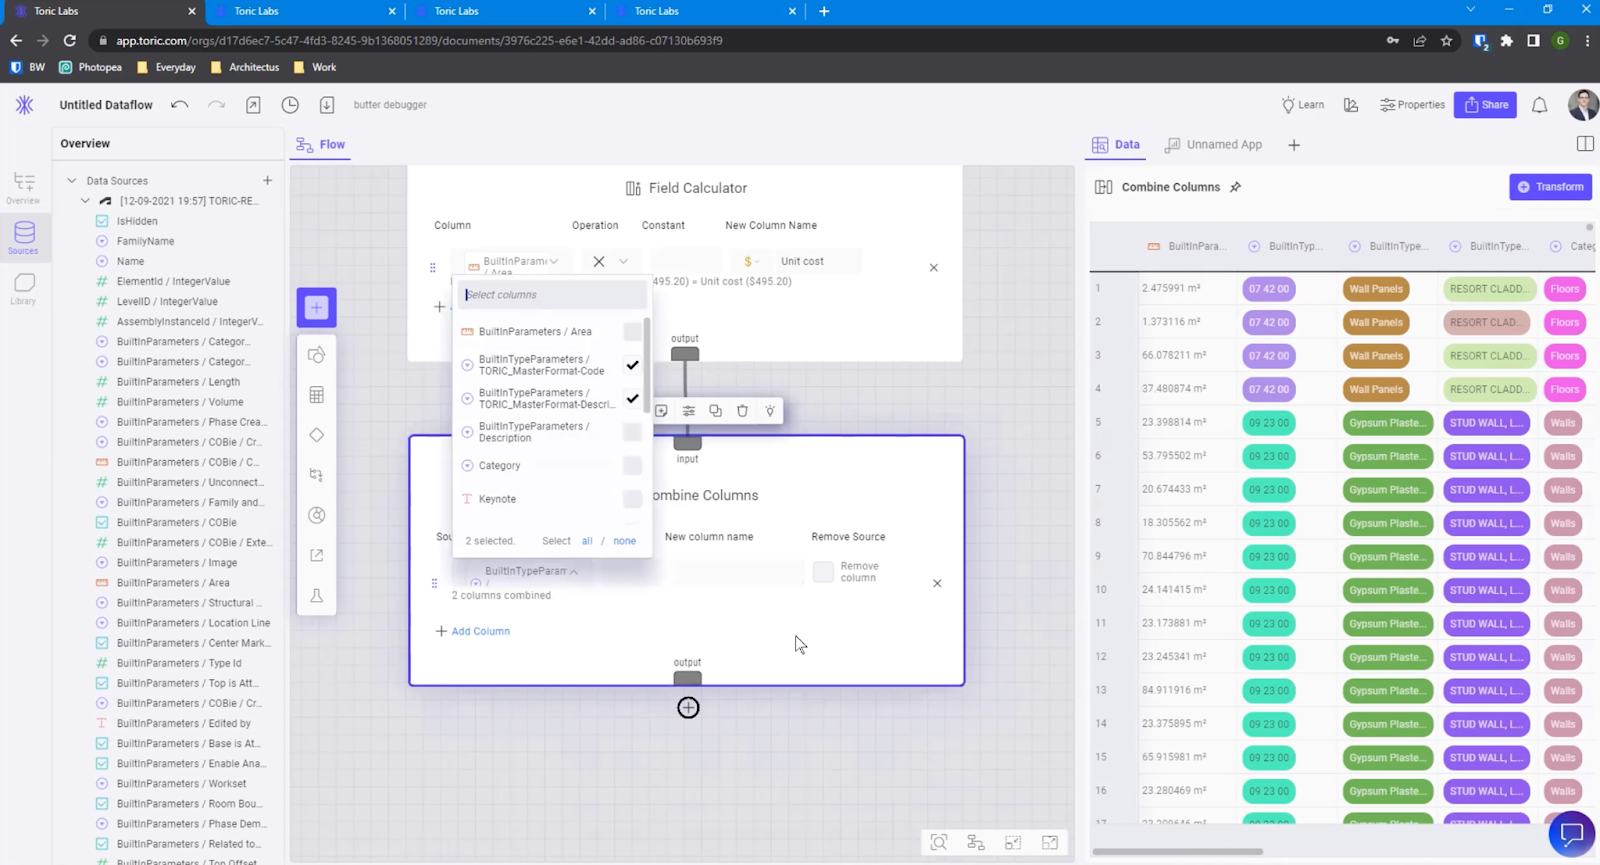
In my example, I have extra columns that I don't need anymore, so my next step is to combine columns into a new one. I currently have a master format code and description, but they're separate, so I want to join them together.
From your field calculator node, create a new Combine Columns node. Within the node, I select my master format code and master format description as my source. I can give it a delimiter like a colon or a space, and I want to name my new column Classification.
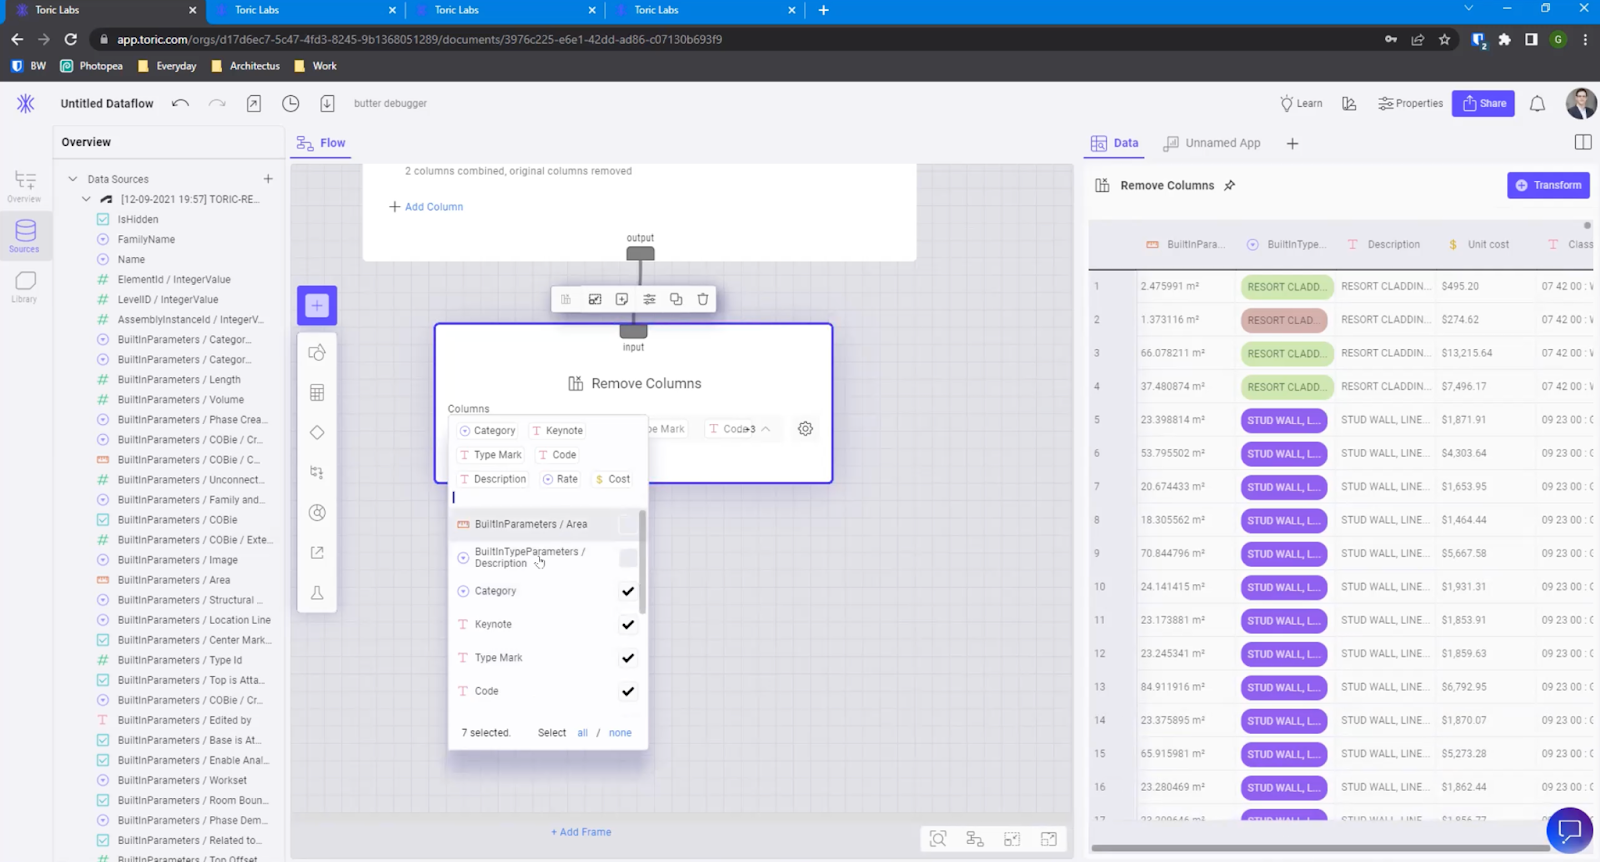
I want to remove the columns I used and any others I don't need for my QTO. I've found Toric provides robust capabilities for using columns in their data analytics workspace.
I already used the area column, so I don't need it, but I will keep it for this example. For now, I will remove the Category, Keynote, Typemark, Code, Description, Rate, and Rate cost columns - everything we have already used up to this point. Removing these columns will allow me to target some precise data points.
Since I have the split view toggled on, I can see the changes immediately taking effect within my table.
Step 7: Change data types
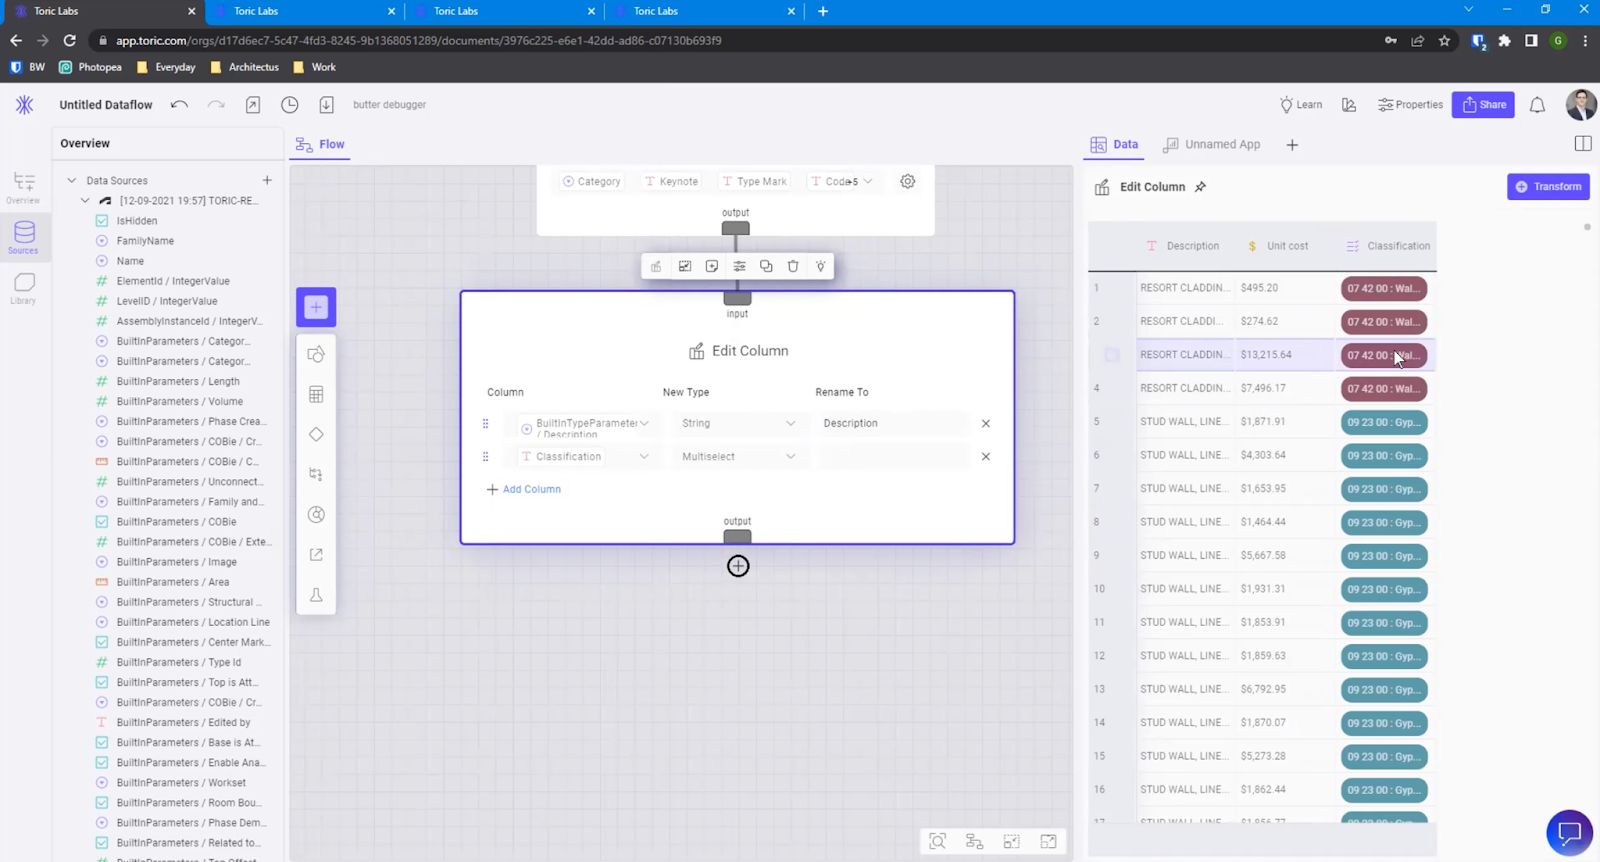
The description of my model is a Revit built-in parameter name, which is difficult to read. In this case, I will create a new Edit Columns node under Remove Columns. This will allow me to rename this column and change the data type within that column. Changing data types makes it more suitable for my end result.
After I created my new node, I selected the Builtin Type Parameter Description column as the one I set to change, set the new type to string, and renamed the column to Description.
I also want to change the column Classification to a multi-select, which will now give all these objects context of when they're the same as other objects. I can now use this to filter drop downs and further slice my data.
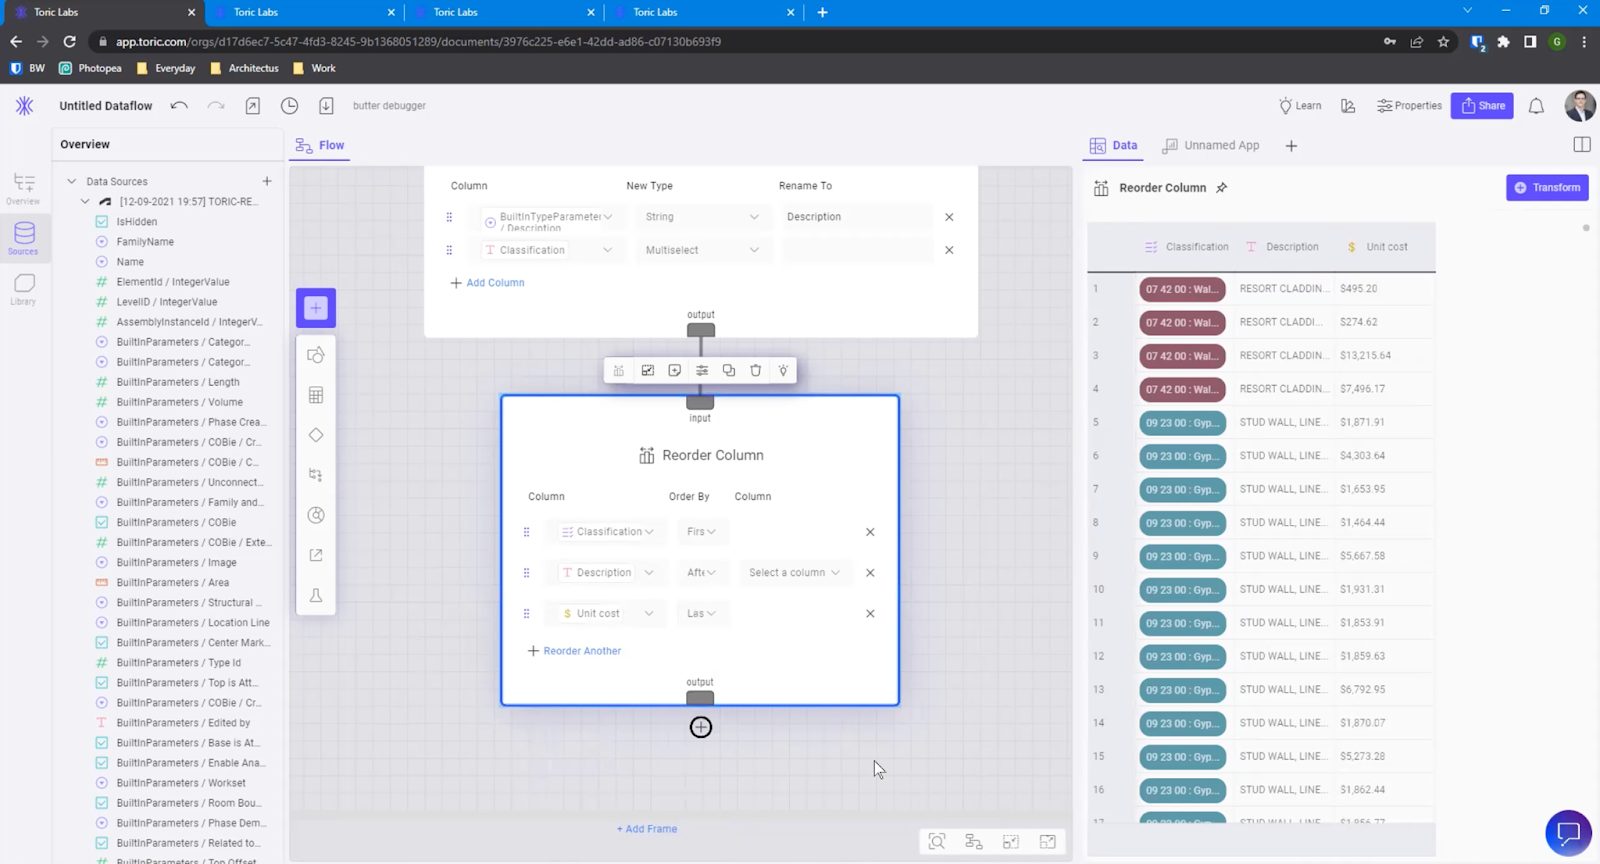
Step 8: Summarize data
The next step in my process is to summarize my data. I don't like the existing order of the data in my table, so I will reorder my columns quickly. To do this, I created a new Reorder columns node from my Edit columns node. I set the order of the columns and how I wanted them to appear within my node.
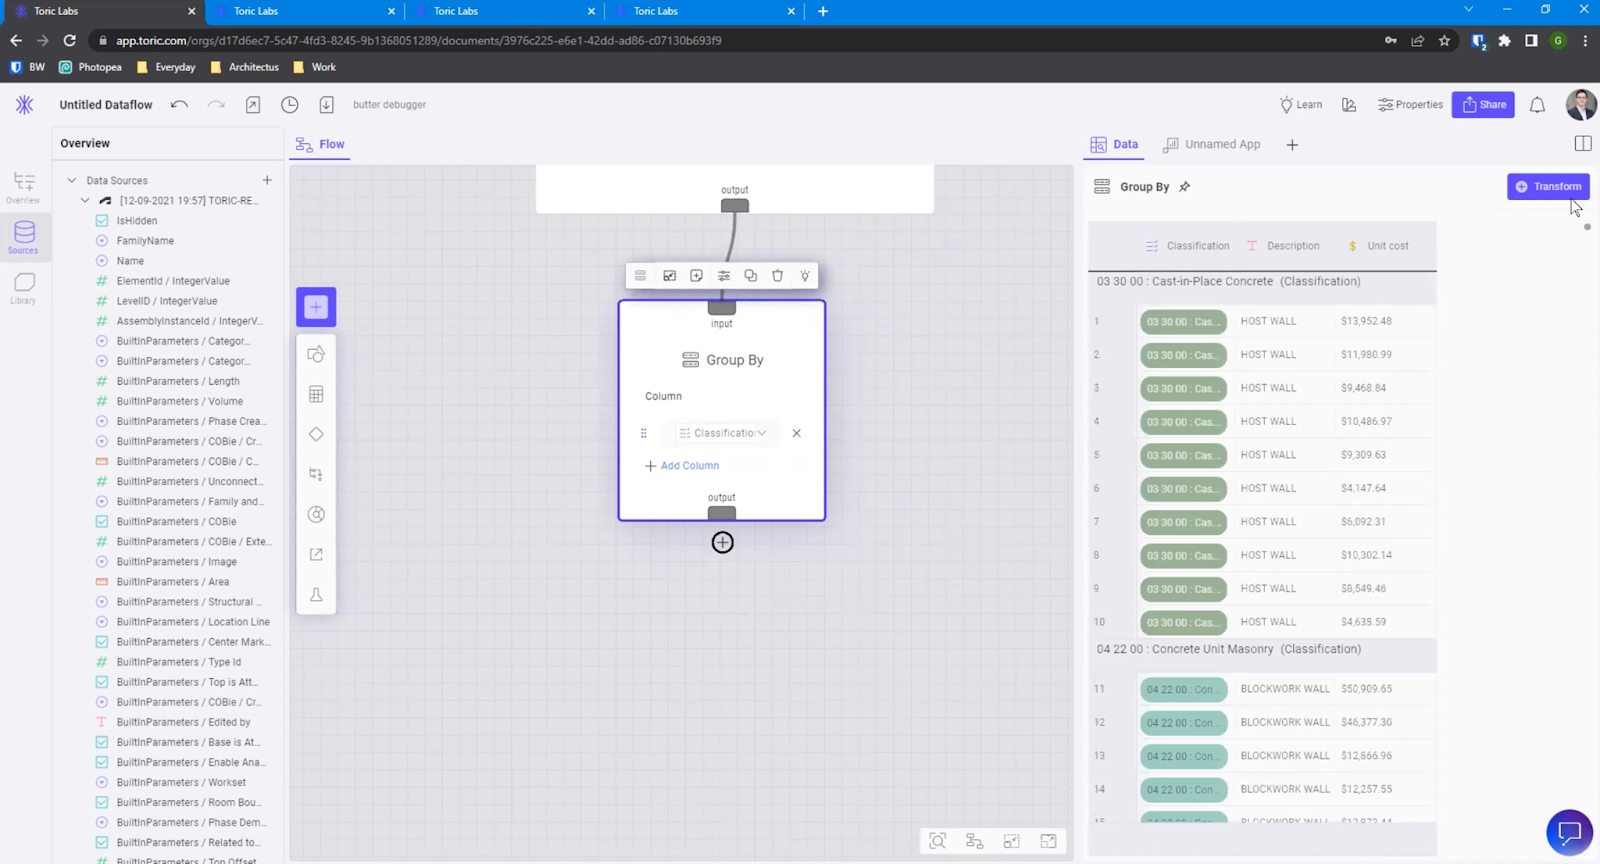
Next, I will group my data by adding a Group by node. This will allow me to group data by my Classification field. Now, my data has automatically grouped and sorted in my table based on the Classification field. This is one of my favorite features of Toric since this task is challenging, even with a Pivot table in Excel. Creating and configuring a new Group by columns node is lightyears faster.
Lastly, I want to summarize and provide a tally based on the Unit Cost. To do this, I created a new Summarize node from my Group by node and selected my Unit Cost field as the column to summarize and set operations to sum.
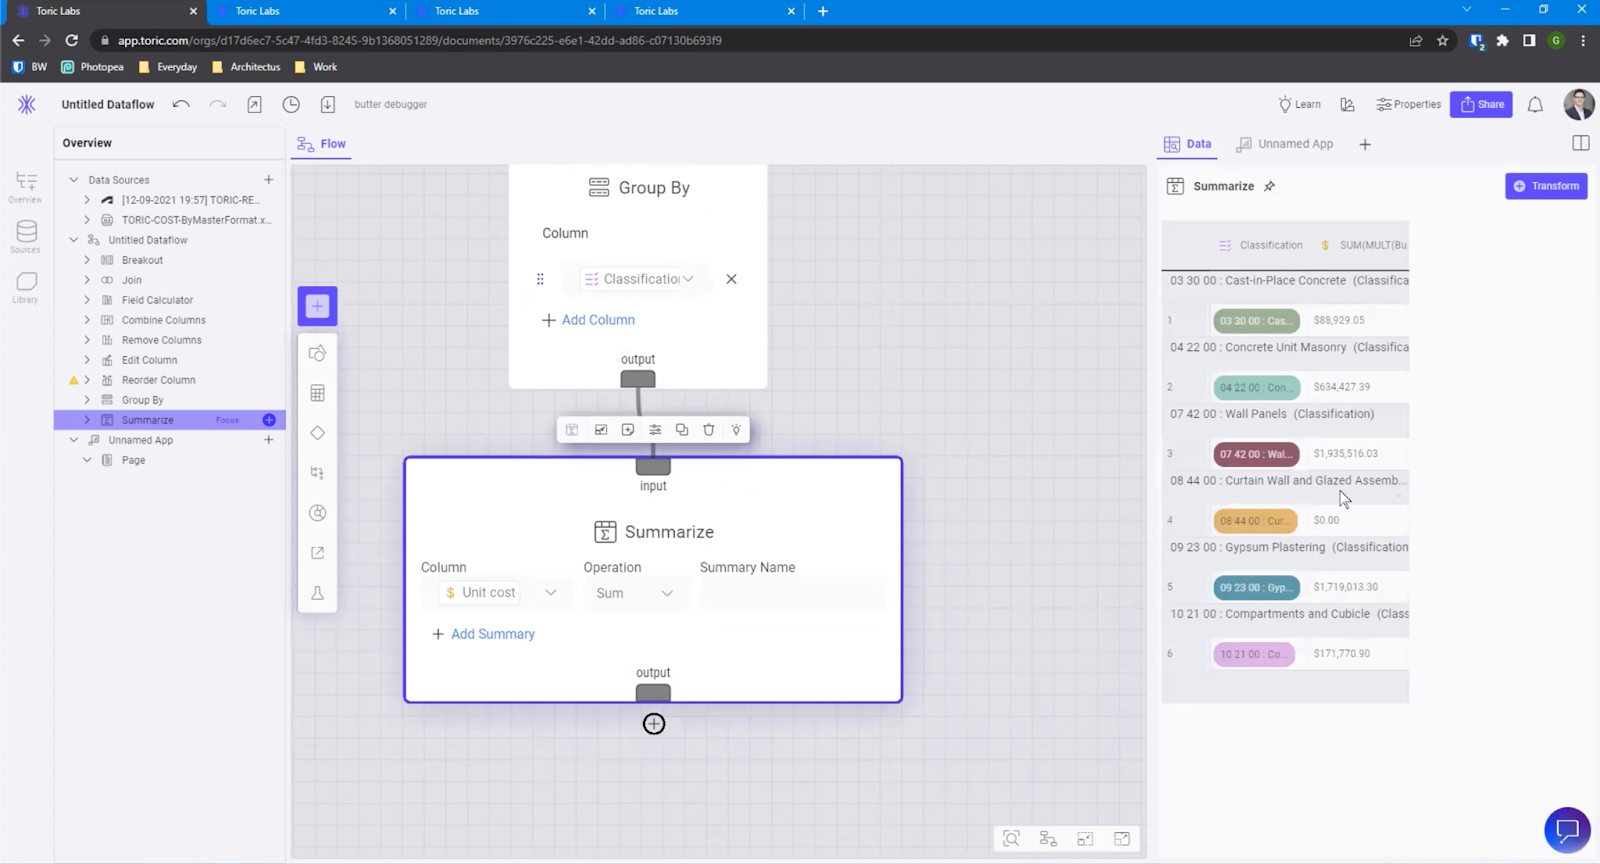
This flagged a few things in my Revit model that I will want to review right away. This is one of my favorite things about Toric. As I am analyzing cost and quantity takeoff, I am also identifying errors in my model based on the data I see as I am processing and visualizing it.
Now that I have summarized my data, I want to add an Ungroup node so the result is a simple row item summary in my table. I have now successfully intersected two complex data sources and created a high-level drill-down of classification types with a summarized unit cost.
Step 9: Build data visualizations
Now I am ready to build my visualization.
Toric allows you to quickly build a data visualization based on the components in a workflow. I can drag a new output line from my node to my visualization canvas using the split view and select from several components like tables, charts, and bar graphs. I can also customize the formatting, like colors, legends, labels, and more. These visuals and charts can be shared in several ways, allowing you to make insights accessible to anyone.

This is an example of how you can quickly throw together a visualization from your Data Flow. For this example, I'll show you the result and backend of my QTO visualization.
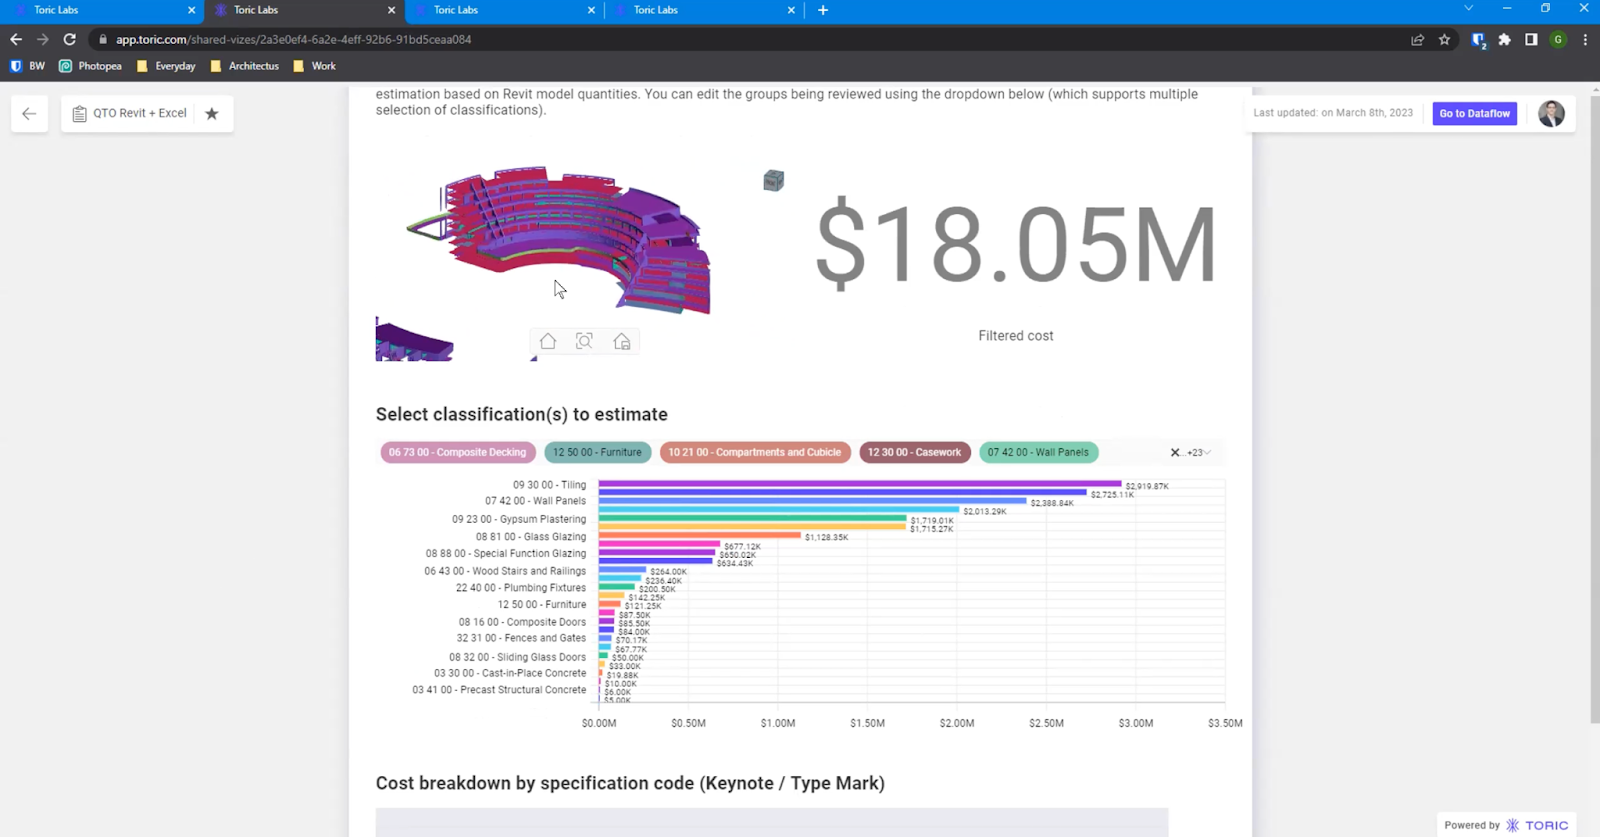
In my example, I included the total cost and a model viewer in my data visualization. This allows me and anyone I share this will to reference and view the model while interacting with my report.
My model is highlighted by category, making it easy to visually reference which part of the model corresponds with my classification types.
Toric data visualizations are interactive, meaning you can select, deselect, and filter the model based on my data table below. This allows me and any user to isolate the model view by classification and see the breakdown of material costs in reference to the model.
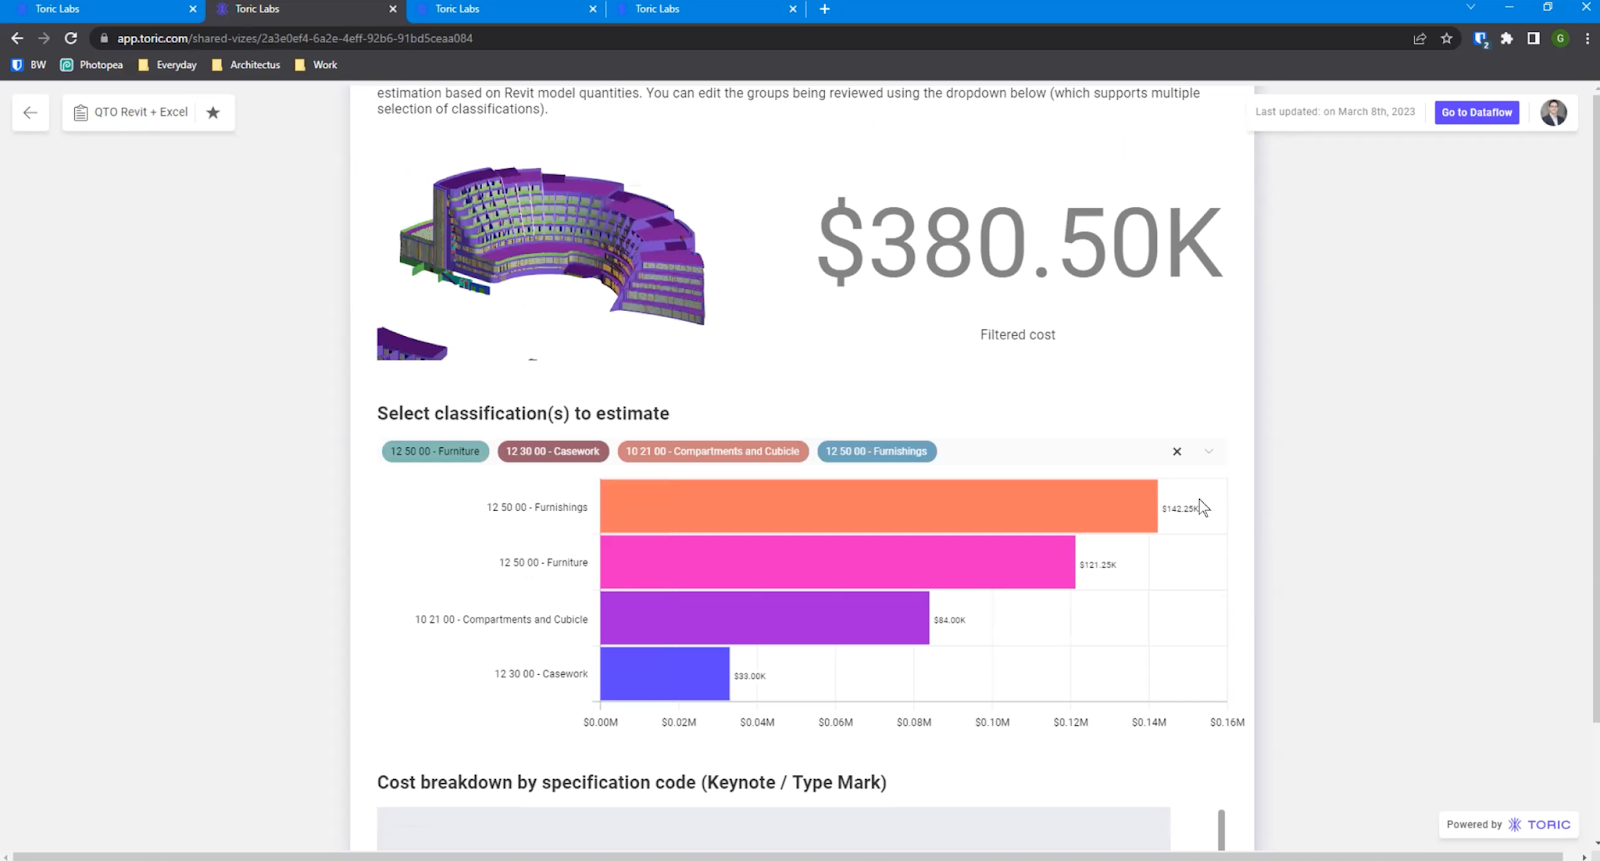
For example, let’s say I want to see how much I'll be spending on furniture since this model is a resort. I can see row item summaries of those objects, but I can also drill into specifics using the descriptions from Revit and see how much I am spending on beds, chairs, or offices. I can now see a high-level or detailed cost breakdown for my quantity takeoff, and I can share this report with any stakeholder. The result is clean, organized, and easy to understand data from a complex Revit model and Excel spreadsheet.
Conclusion
When I started using Toric’s Data Analytics Workspace for this tutorial, I asked myself, how will I do this?
I was so used to tools needing dedicated training and time to learn how to use them, that I expected this process to be much more difficult. It took me about 30 minutes of playing around with Toric, thinking through my problem to get to the dashboard I showed today.
Toric is quick and easy to set up and has a user-friendly interface to perform complex data engineerings functions like data ingestion, storage, processing, transformation, and visualization without writing any code.
I want to reiterate that Toric is a SaaS solution, and as someone used to local, CPU-heavy programs, this is a huge benefit. I'm used to working with multiple software versions at once and often non-backward compatible software. With Toric, I'm always getting the latest software version with its newest features without manually checking for updates.
I'm always working on getting my data operations and data pipeline to be the fastest it can be, and Toric has unlocked new possibilities and greatly improved my speed for “time-to-insights” and my ability to turn data into actionable insights much faster.
I would need a significant amount of scripts, tools, and custom solutions to facilitate this type of analytics on Revit data without using a tool like Toric. The ability to break down my Revit data in fairly complex ways while intersecting it with other data sources is a game changer for anyone in the BIM world.
Using Toric, construction professionals can optimize their data operations and workflows, reduce errors, save time and money, and build smarter. Toric is the future of data analytics in construction project management, and it's time to start using it today.
I hope this has been a useful tutorial! Head over to our on-demand webinar to watch the full construction demonstration and deep dive, and hear practical advice from a Cost Analytics Manager Michael White from Betenbough Homes on his data strategy for better cost and estimation insights.
Here’s a sneak peek of his work discussed in his presentation here:
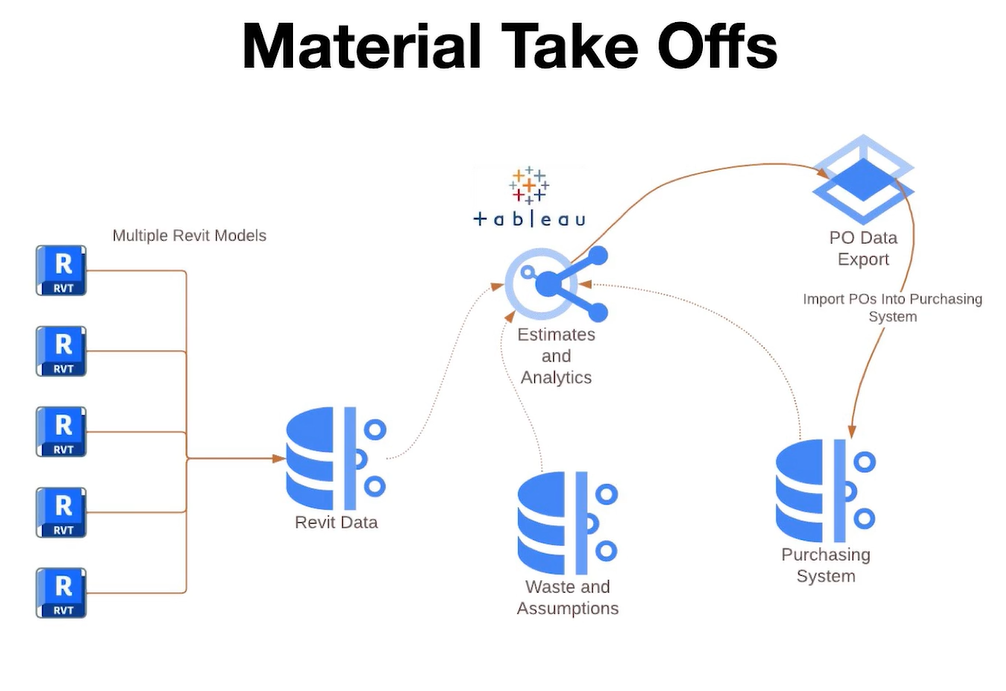
Thanks for having me Toric!
About the author
Gavin is a highly accomplished BIM Strategist with over 10 years of experience in the industry. He has held senior leadership positions in various organizations, where he has demonstrated a track record of driving growth, managing complex projects, and leading high-performance teams. He is currently working at Architectus as a computation and BIM lead.
.png)


.png)


