
How to use Revit data to perform a Model Audit for Warnings
Learn more about what’s possible using Toric and our Revit connector by viewing our “Model Audit” templates for additional example reports such as using Revit data for cost estimation analytics & quantity takeoff explained in this tutorial.
What is a Revit Model Audit for Warnings?
Revit is one of the most widely used software applications in the construction industry. It’s used by architects, engineers, and construction professionals to design and document buildings and allows designers to create detailed 3D models of their projects, which helps them visualize the building and identify potential design issues early in the process.
As models become complex and teams grow, the chances of errors occurring increases. To prevent these issues from occurring in your designs, Revit offers a Warnings tool that analyzes your Revit files and identifies potential design and engineering problems. The more errors Revit identifies in your model, the more warnings you will see reported in Revit. A high volume of warnings can cause model files to become sluggish, slow to load, and difficult to identify errors and make changes efficiently.
The challenge I will be solving for today is how to conduct a model audit for warings and create an actionable report to get a detailed view of the issues in my model and provide informed solutions. You can perform multiple model audits in Toric, including Design Comparison, Project Change Tracker, and auditing Grids and Levels. I recommend getting started with model audits using one of Toric’s existing templates.
What is Toric?
Toric is a SaaS-based data analytics workspace that has 50+ pre-built data connectors to industry-standard software like Procore, Autodesk, and Primavera P6 to name a few. It is designed to be a fast and efficient way to ingest, process, and analyze data, including Revit files.
Toric’s Revit connector allows users to:
- Ingest model elements and datasets by importing local files or configuring the connector
- Create automations to ingest Revit or Autodesk Construction Cloud data so you always get the most up-to-date model in your data flows and visualizations
- View and use multiple versions of your Revit model to compare planned vs actual and see how models change over time
- Use no-code data transformations to link and join your Revit model to any other piece of data you have - like financials, estimating, scheduling, and many more.
- If Toric doesn’t support the specific connector you’re looking for, you can also connect to 3rd party software in Toric via webhooks and Toric’s API. Or you can import files with a connector like DropBox or upload it manually by importing a csv, xls, etc.
Toric’s capabilities with using Revit for analytics is among the best I’ve seen in the industry, and has multiple use cases for Revit, as seen in my webinar and written tutorial on how to use Revit data in Toric to perform cost analytics and quantity take off.
For this example, I am using Toric to analyze the performance of my Revit files and run a warnings report without installing any software locally.
Tutorial: Performing a Revit Health Check in Toric
A Revit Health Check is an essential part of maintaining a high-quality Revit model. By using Toric, a powerful data analytics tool, you can perform health checks efficiently, ensuring that your Revit models are free of issues and inconsistencies. In this tutorial, we will walk through a step-by-step process for performing Model Audit on Warnings in Revit using Toric.
Workflow
- Exporting the Revit model and importing it locally to Toric
- Creating data flows to transform and filter data down to focus on warnings and levels for visualization
- Using the breakout and join data operations nodes to map the level IDs to level names and generate a report on the warnings.
- Building a data visualization using a 3D model viewer to further inspect the model's warnings by floor or element.
Requirements
- Autodesk Revit account
- Toric paid plan with access to the Revit Connector
- Familiarity with Revit and basic knowledge of Toric
Step 1: Preparing your Revit model
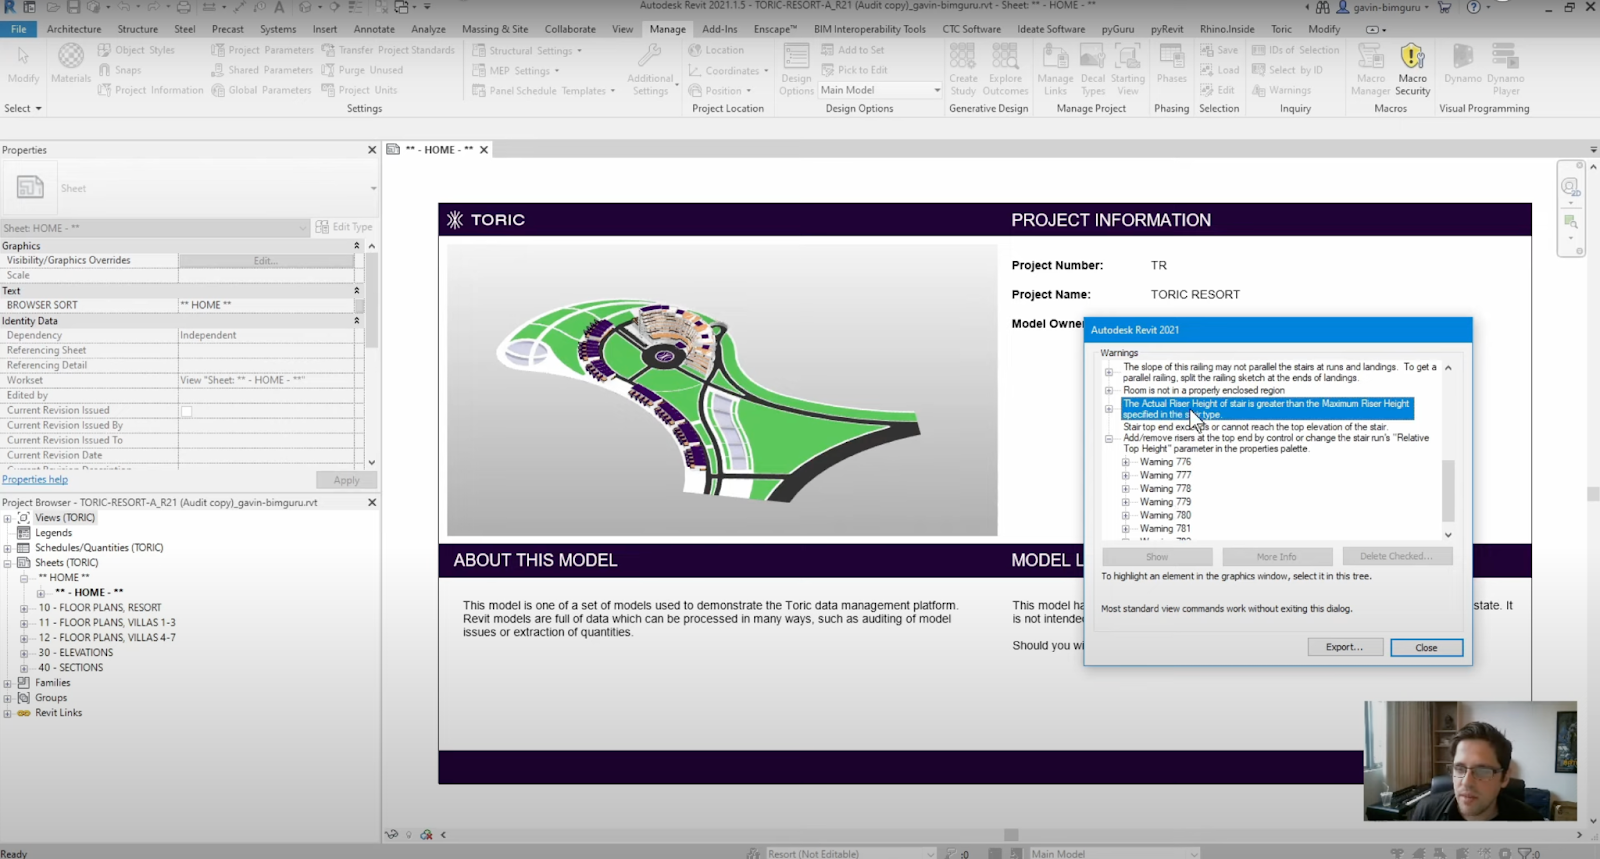
Open your Revit project. Ensure that your model is up-to-date, and save your current version if necessary. Navigate to Manage and find the Warnings tab. This should open a panel and give you a list of warnings found in the model.
For context, the model I am using in this example contains close to 800 warnings. This is considered on the lower end of warnings I would expect to see in a Revit model. They can vary in severity, but as you can see here it’s hard to navigate through the warnings and get a clear picture and understanding of the right solution. This is why we are pulling this data into Toric.
Step 2: Exporting Revit data to Toric
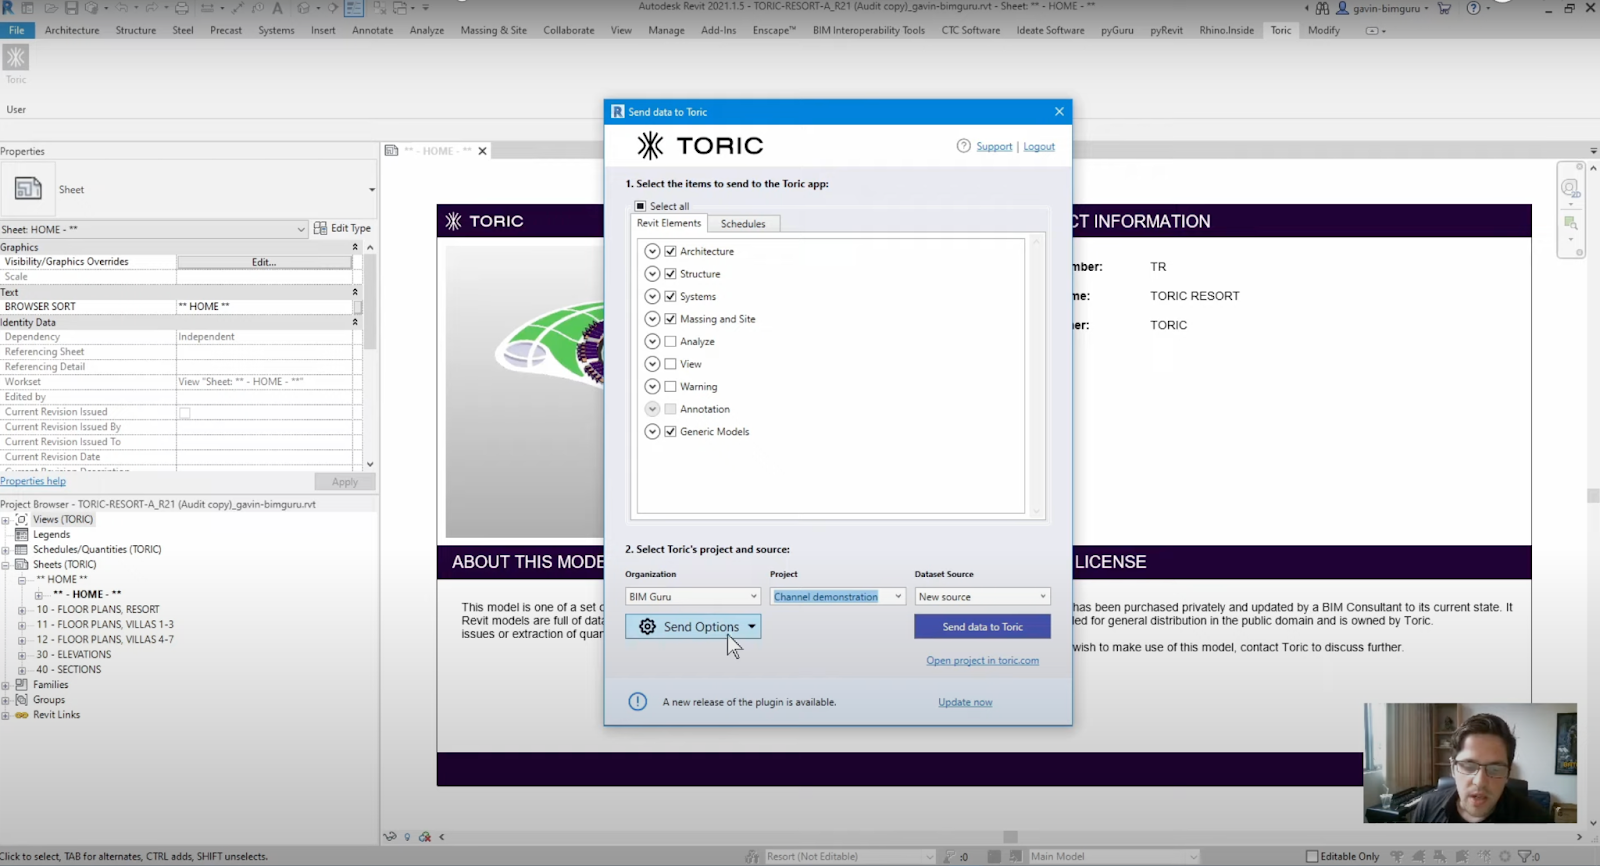
In Revit, navigate to the Add-Ins tab. Click on the Toric icon. In the Toric dialog box, select the data you want to export for the health check, such as:
- Elements and their parameters
- Warnings
- Model groups
- Worksets
Click "Export to Toric." Wait for this export to say Finished under send options
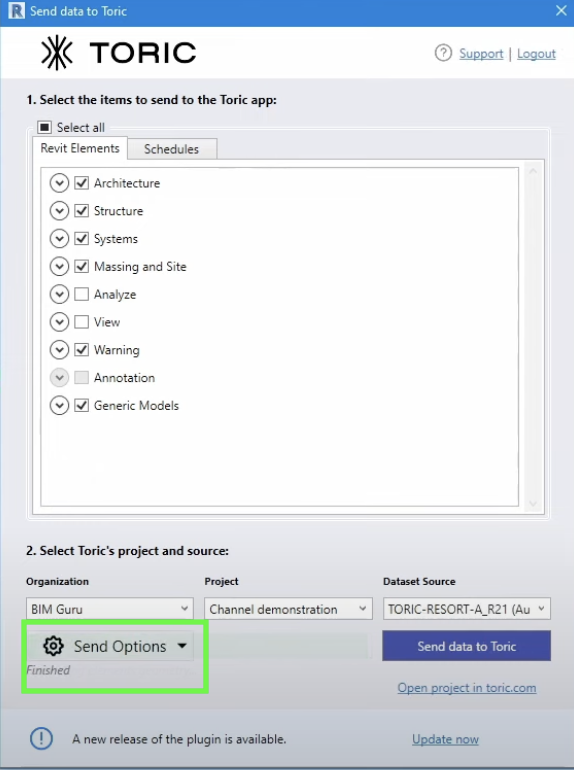
Once the export is complete, log in to your Toric account.
Step 3: Preparing the Toric workspace
Create a new data flow in Toric and rename it to Warnings report.

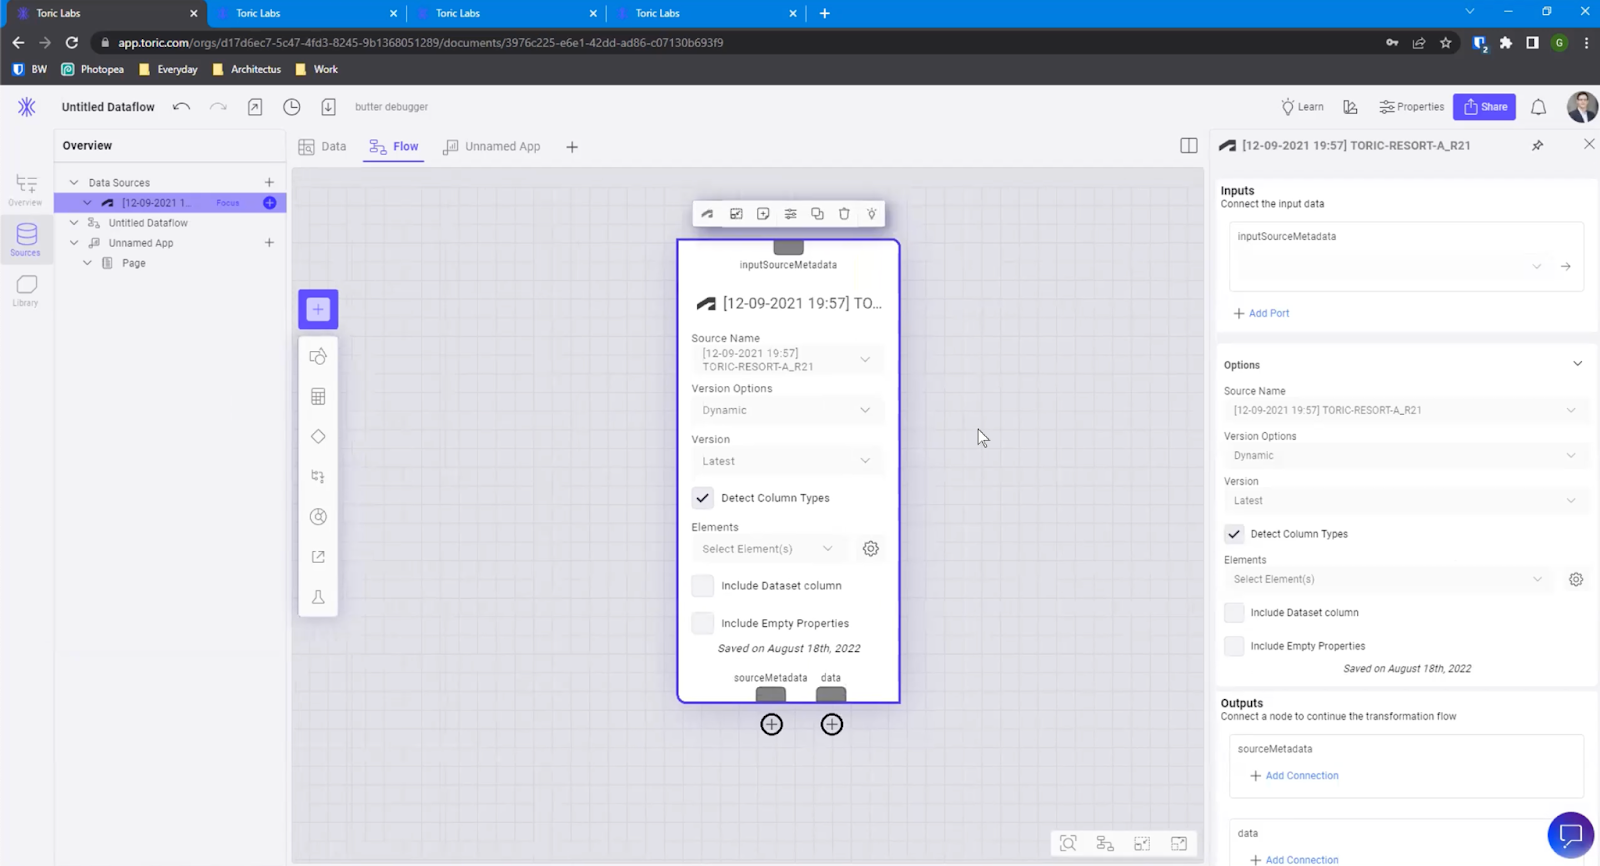
Click on Sources and select the data you exported from Revit.

This will create a source node for your Revit model. In this node, we want the most up-to-date version of the model, so set Version Options to dynamic, and Version to latest. For Elements, I want to pull in warnings and levels.
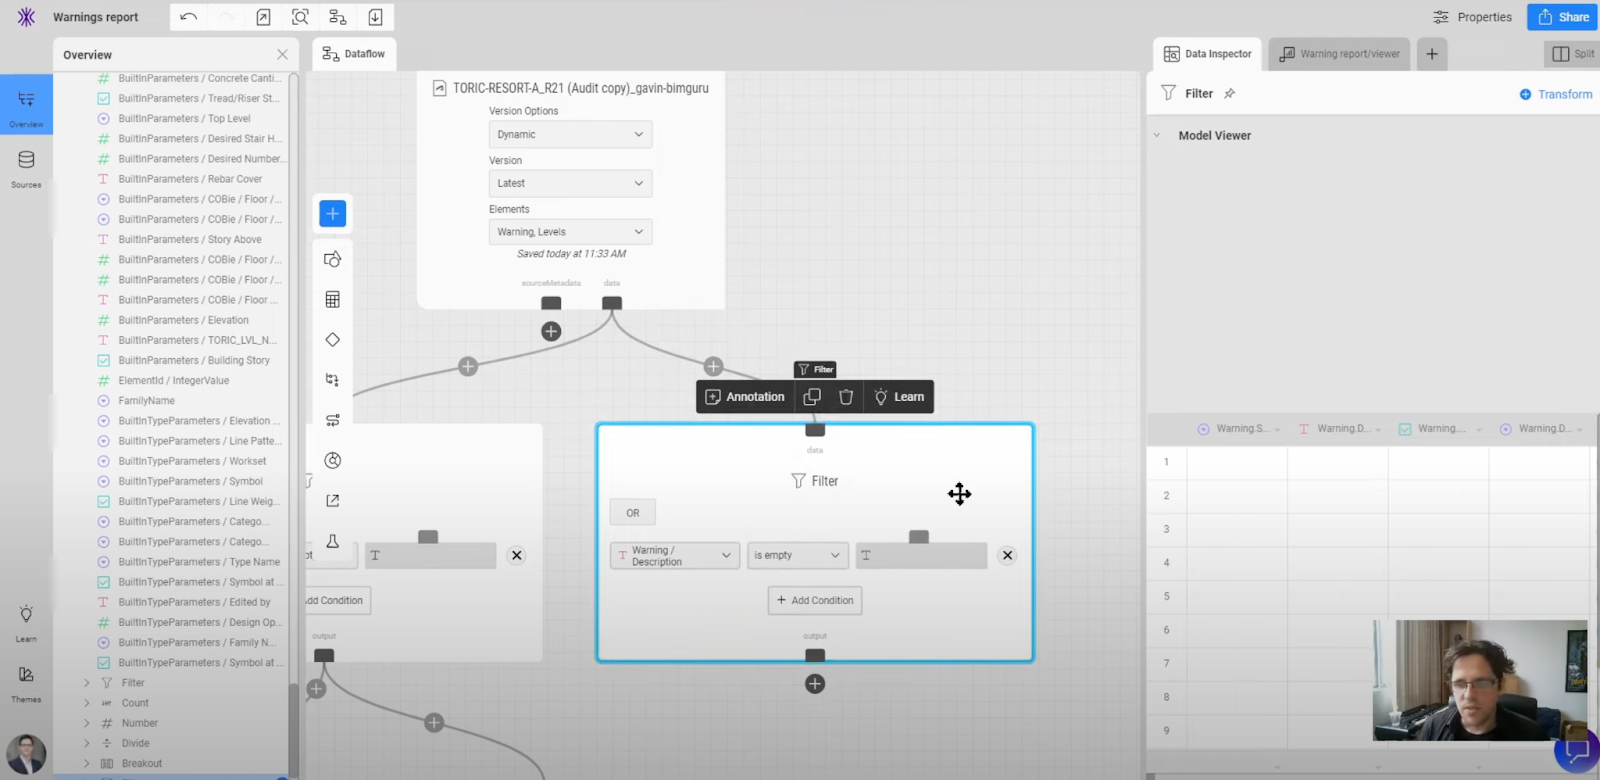
Step 4: Filter the Revit data using Toric
Create a new Filter node in your Toric workspace after the Revit source node. When filtering, select the column or property that only a warning could have.
For my example, I can’t choose an element because this will only show me the specific object, like walls, stairs, and room, that is associated with the warnings in our model. I will instead select the warning description and set the logic to not empty. Now, this has filtered my Revit data in Toric to only display data associated with a warning.

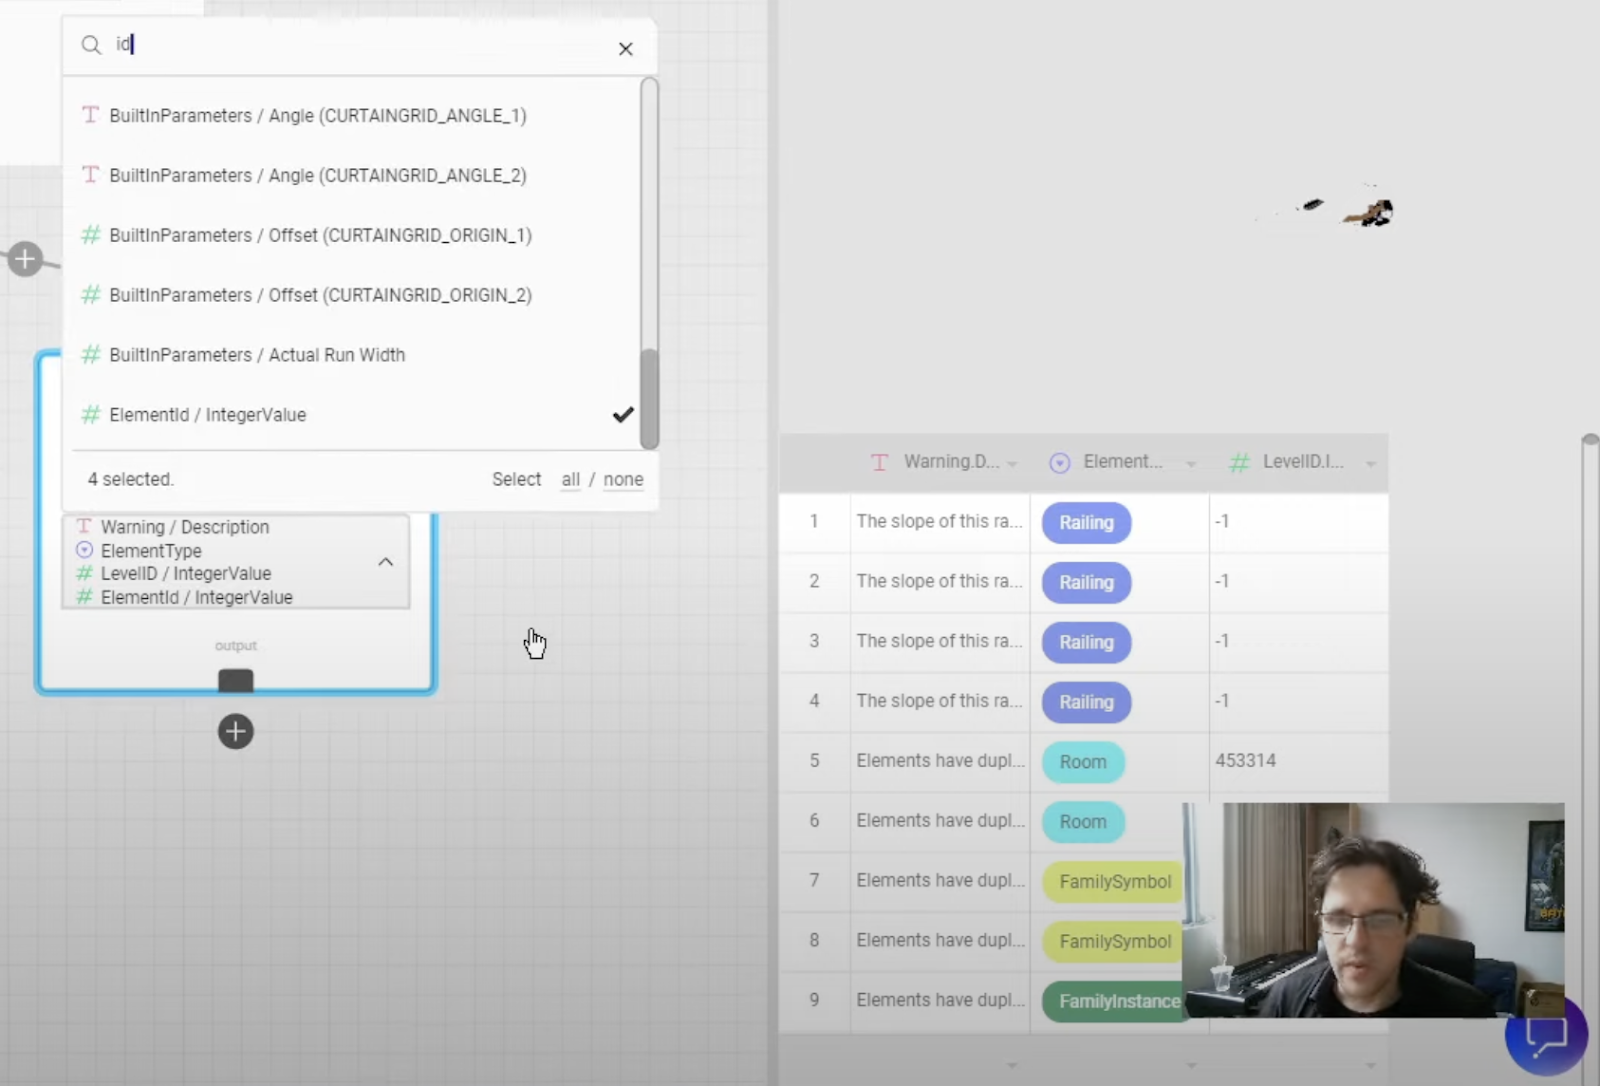
Step 5: Breakout key data
Create a breakout node and select the columns you are interested in. For this example, I am selecting:
- Warning description
- Element
- Level ID
- And Element ID
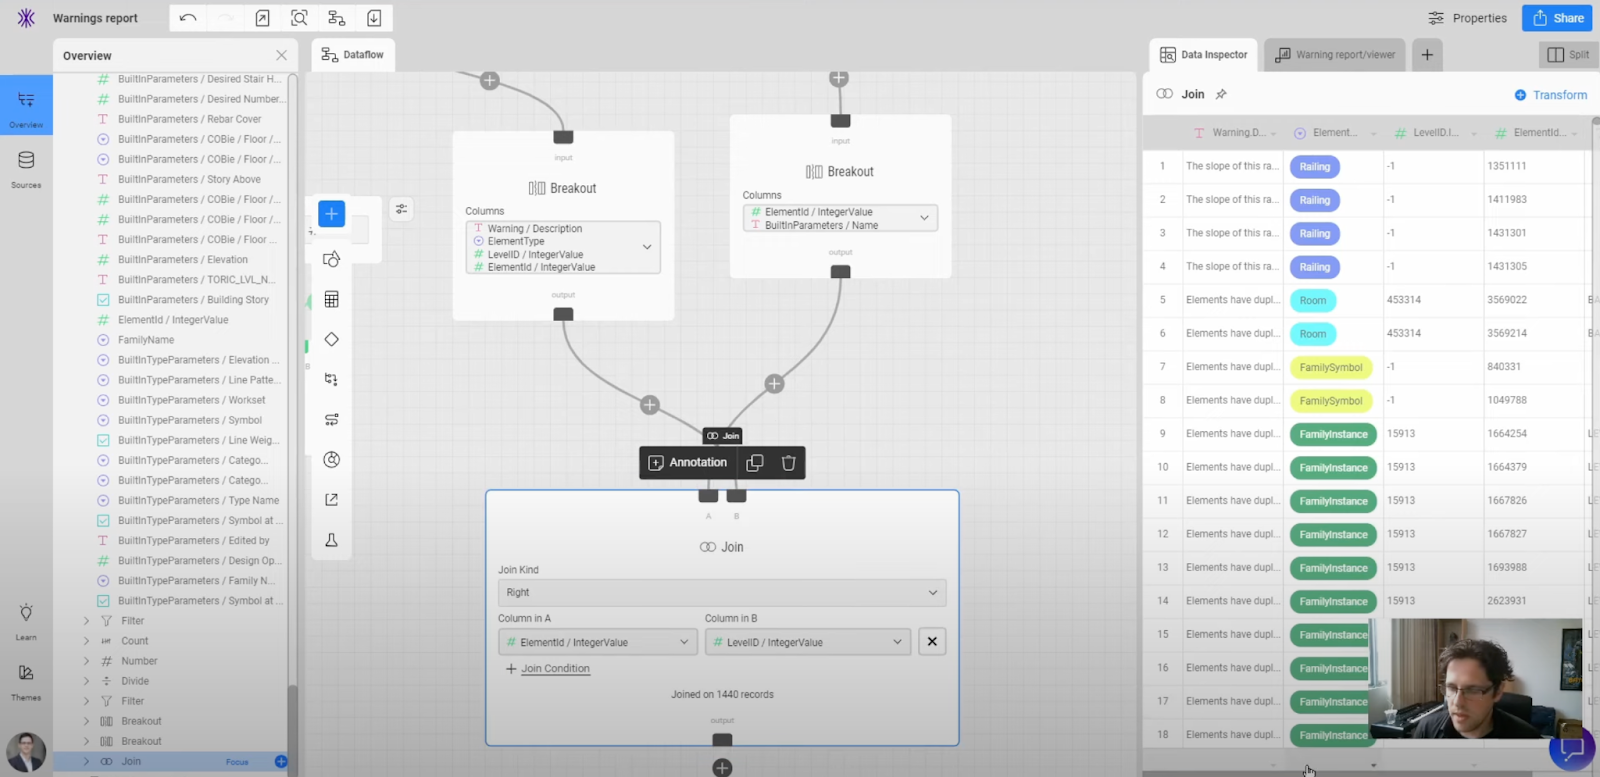
Step 6: Breakout and join datasets
Now my data is broken out into the properties that will help me identify the areas and objects associated with warnings. Now, I need to turn the Level ID property into an actual level to make resolving errors easier.
Duplicate the first filter node, and add it to the right branch from your Revit source node. Reverse the criteria of this new node to filter by warning description is empty.
Add a Breakout node to your filter node. Select the column Elements ID and Parameter name.

I can now use this ID to effectively map the Level IDs to their associated level name. To do this, I will add a Join node. Connect the join node to both of the breakout nodes. Here I am using a Right Join. Here I will set the Element ID in Column A to join with the Level ID in Column B.
I can now see in my data table that Toric has effectively joined the Element ID with the associate level the warning is found on.
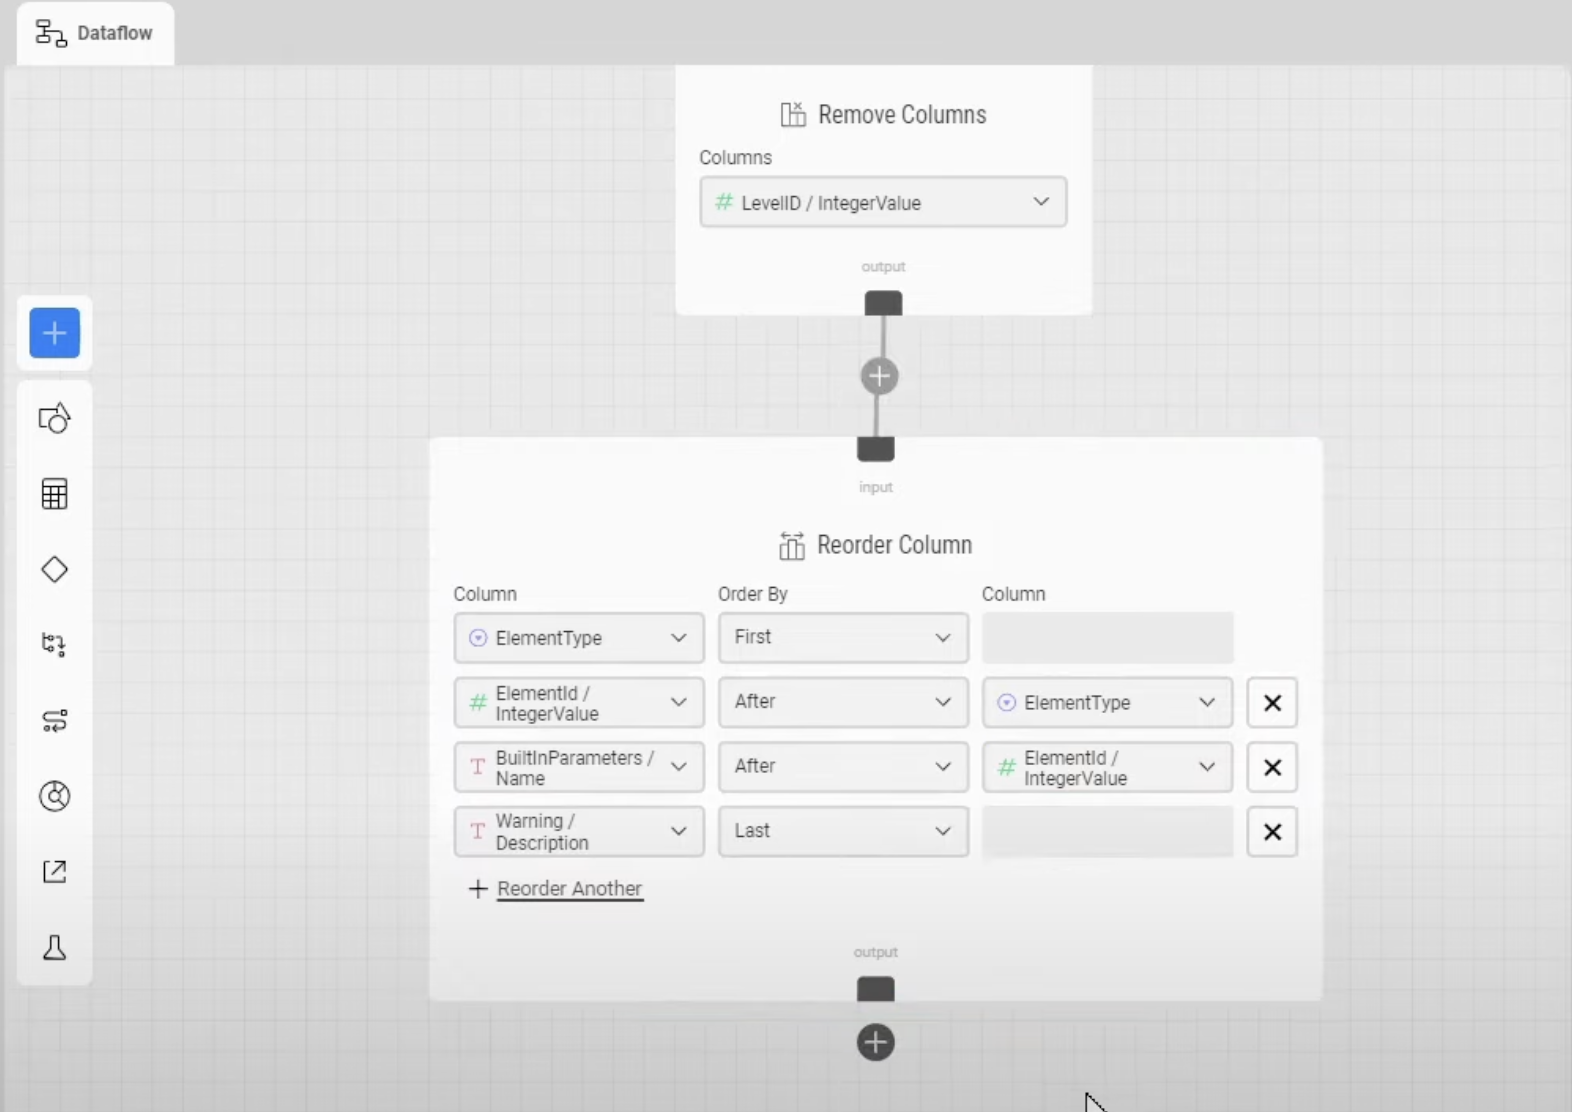
Step 7: Clean columns for reporting
Before I move on to build my visualization, I want to remove, reorder, and rename columns to make my data easier to use for reporting.
Create a new Remove columns node and select Level ID as the property to remove. Add a Reorder columns node. I want my elements to appear first to see what objects the warnings relate to. I am going to put the element ID after the element type, add my levels to appear after the element ID, and have my warning description appear last.
Now I want to rename columns to make them easier to understand in my report. Create a new Column rename node. I will rename:
- Element Type
- Element ID
- Built In Parameter Name
- and Warnings Description

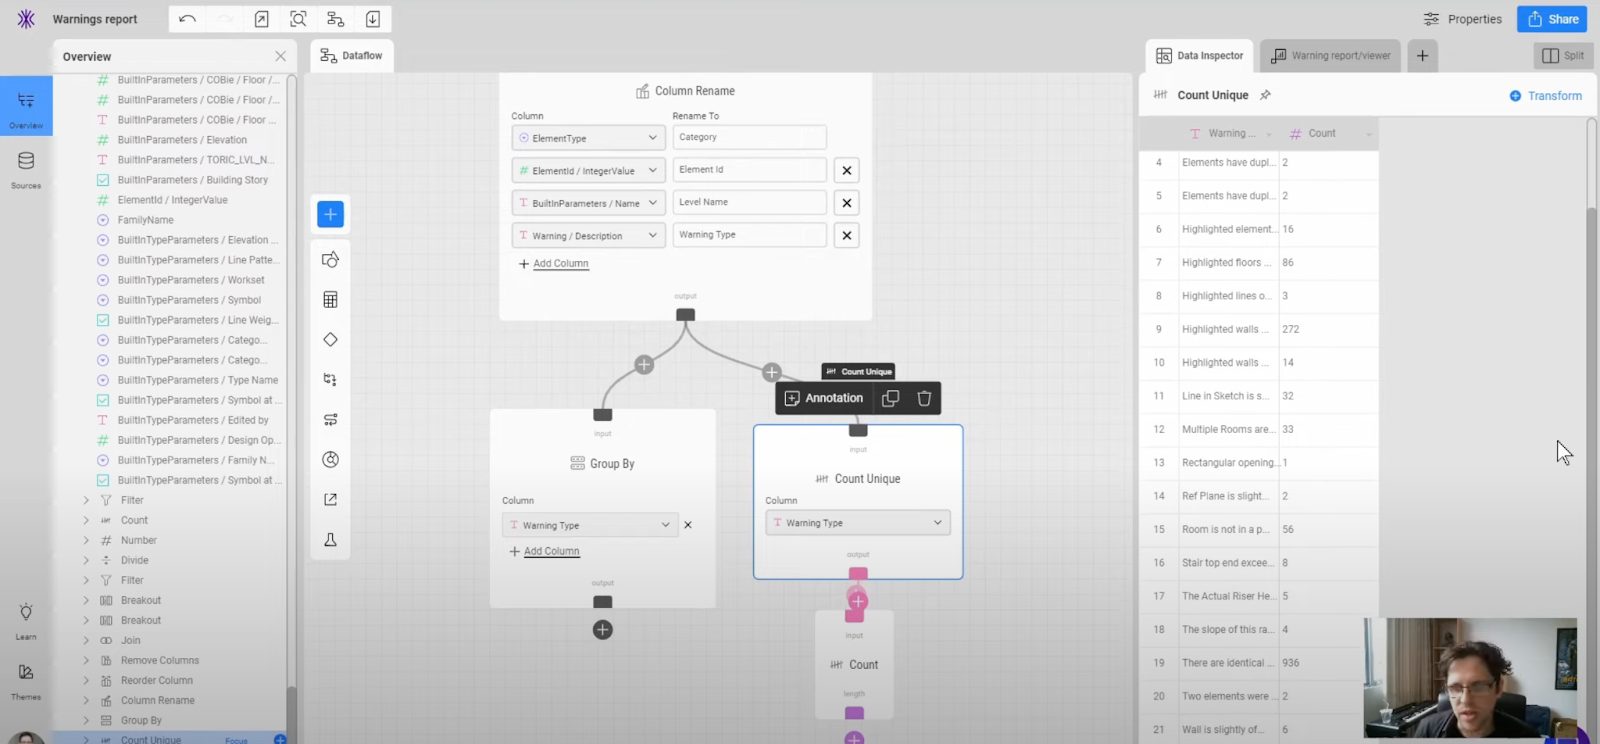
Now I have more readable names for the objects in my report. The last thing I need to do is group warnings by Type.
Create a new Group by node from the Columns rename node and select the Warning type. The end result is a data table neatly organized by the objects related to them. Now I want a count of the warnings and the objects associated with them, so I also need to add a Count unique node and set the columns to count by Warning type. Now I can see the count of warnings and count of objects associated with each warning type.
Step 8: Build the warnings report
Now we are ready to build our report. Toggle on the split view in your data flow if you don't already.
First thing I want to do is add a model viewer to my visualization. Click Add and search for Model Viewer. Connect your data to the Model viewer in a few ways:
- Click into the mode viewer and set the data type within the component
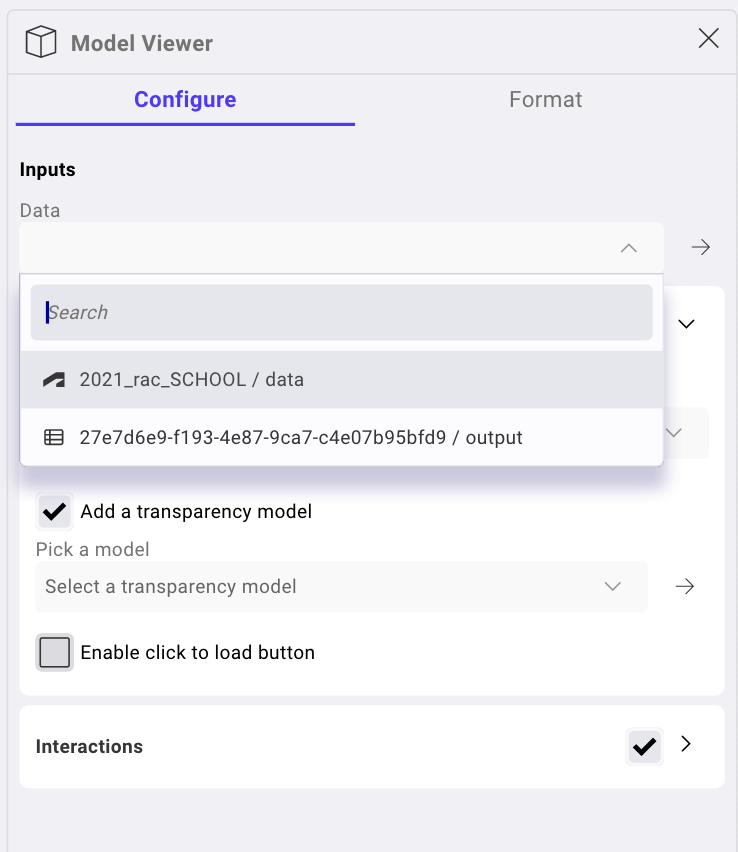
- Drag your source node to the mode viewer component

With this model viewer, you can interact with the model by zooming in and out, scrolling, and moving points of view to analyze your model's different levels, angles, and elements. I like to set a home view so if my view gets disrupted, I can reset it.
Now I can see that my viewer is displaying the objects associated with warnings in my model. I can also place objects in my visualization canvas to create my own scorecard. I can format my objects and customize display options like title, summary, and order.
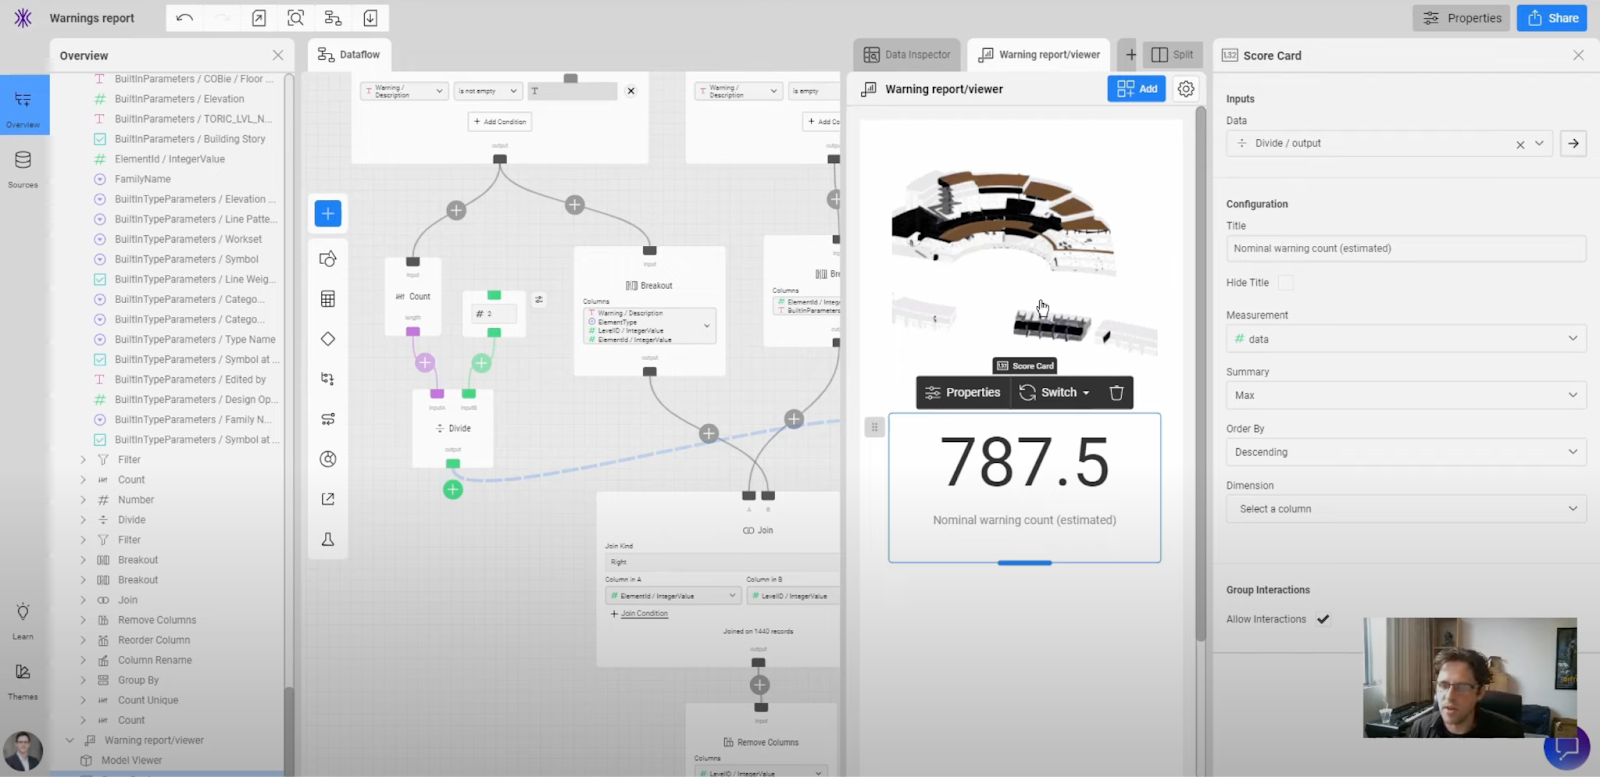
You can control configuration and formatting in the settings panel of your visual components. Now I will repeat this process by adding metrics from my data flow that I want to appear in my visualization.
Step 9: Share your report
My report is now complete and ready to share with a colleague or project team. Click the Share button and determine the settings for sharing. Share with individual people via email, or set Toric to share access with your organization on Toric - this will publish your visualization for all team members with a Toric account associated with your organization.
You can set a password or expiration date to add additional security capabilities. You can also determine if you want your sources within your report to be shared.

Conclusion
Using Toric with your Revit data can be a game changer, and allows you to quickly and easily identify the key problems that the model is likely presenting with. I highly recommend getting started with the Design Comparison, Project Change Tracker, and Grids and Levels model audit templates to easily plug in your own Revit data and see similar results without the setup time.
With Toric, you can quickly identify key issues with your Revit data and take necessary actions to ensure compliance with standards. So, if you're looking to save time and effort in identifying errors, I highly recommend giving Toric a try. With Toric, you can unlock all of its features and connectors by signing up or getting started with the basics for free.
I hope you found this tutorial helpful in learning more about using Toric and Revit data!
About the author
Gavin Crump is a highly accomplished BIM Strategist with over 20 years of experience in the industry. He has held senior leadership positions in various organizations, where he has demonstrated a track record of driving growth, managing complex projects, and leading high-performance teams. He is currently working at Architectus as a computation and BIM lead.
.png)


.png)


