🤖 Join the Waitlist to our AI Copilot for Your Data. Get Early Access
WHAT'S NEW
This feature allows you to further control the visual elements of your dashboards and reports. You can now add color to (or remove color) from the dropdown items in your visualizations by a simple toggle button. Within the dropdown’s property settings, navigate to Format. In the Dropdown tab, you’ll now see an option to toggle colors on or off.
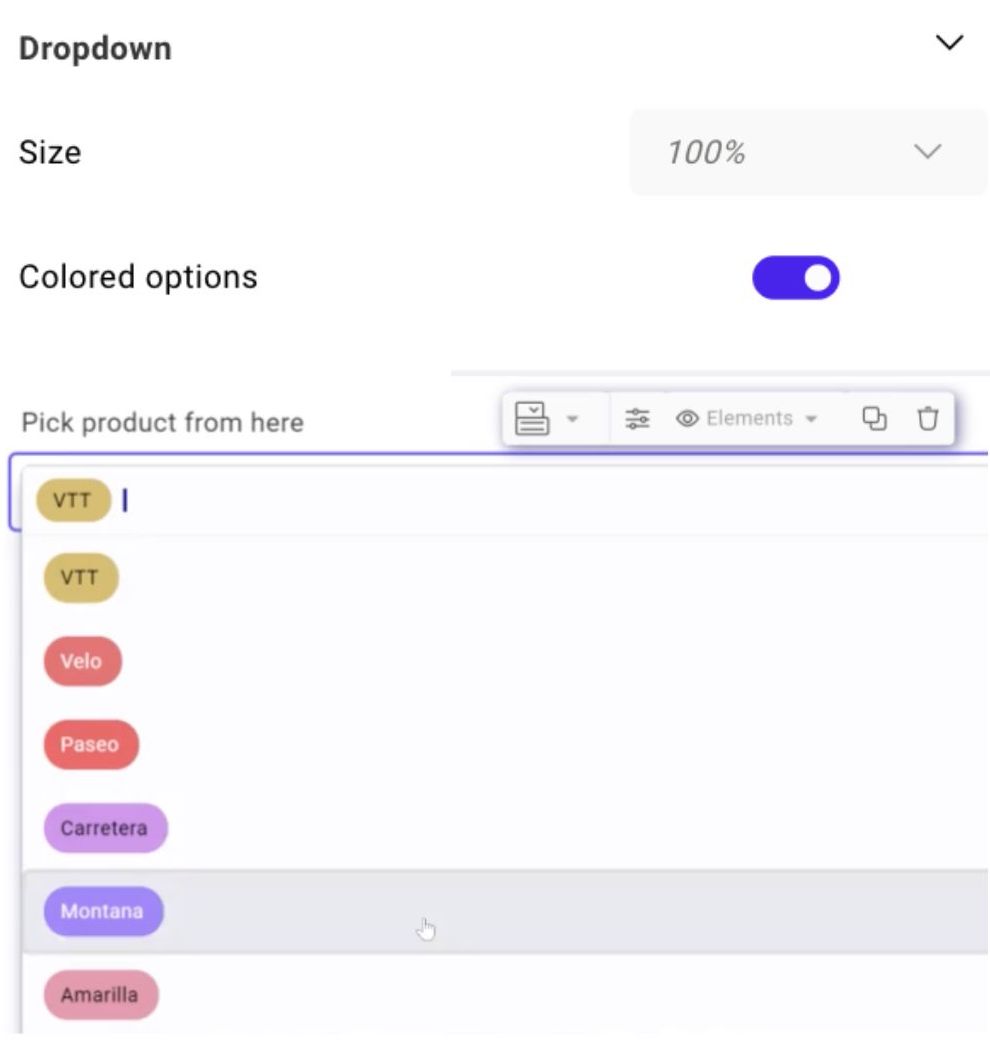
 Dropdown color formatting
-min%20(1).jpg)


It’s essential to have security, governance, and control over how your data visualizations are shared. We’ve added new configuration options when it comes to sharing your dashboards and reports in Toric.
Users now have the ability to share their visualizations securely by:
Adding a password
Create your own secure password to share a visualization. This adds an additional layer of protection, and your end users can still access the and use your report or dasboard.
Setting expiration dates
Determine when or if you want your sharing likes to expire. You can now set no expiration date, or select from a number of options including:
The shareable link that is available will expire within the timeframe selected by the user.

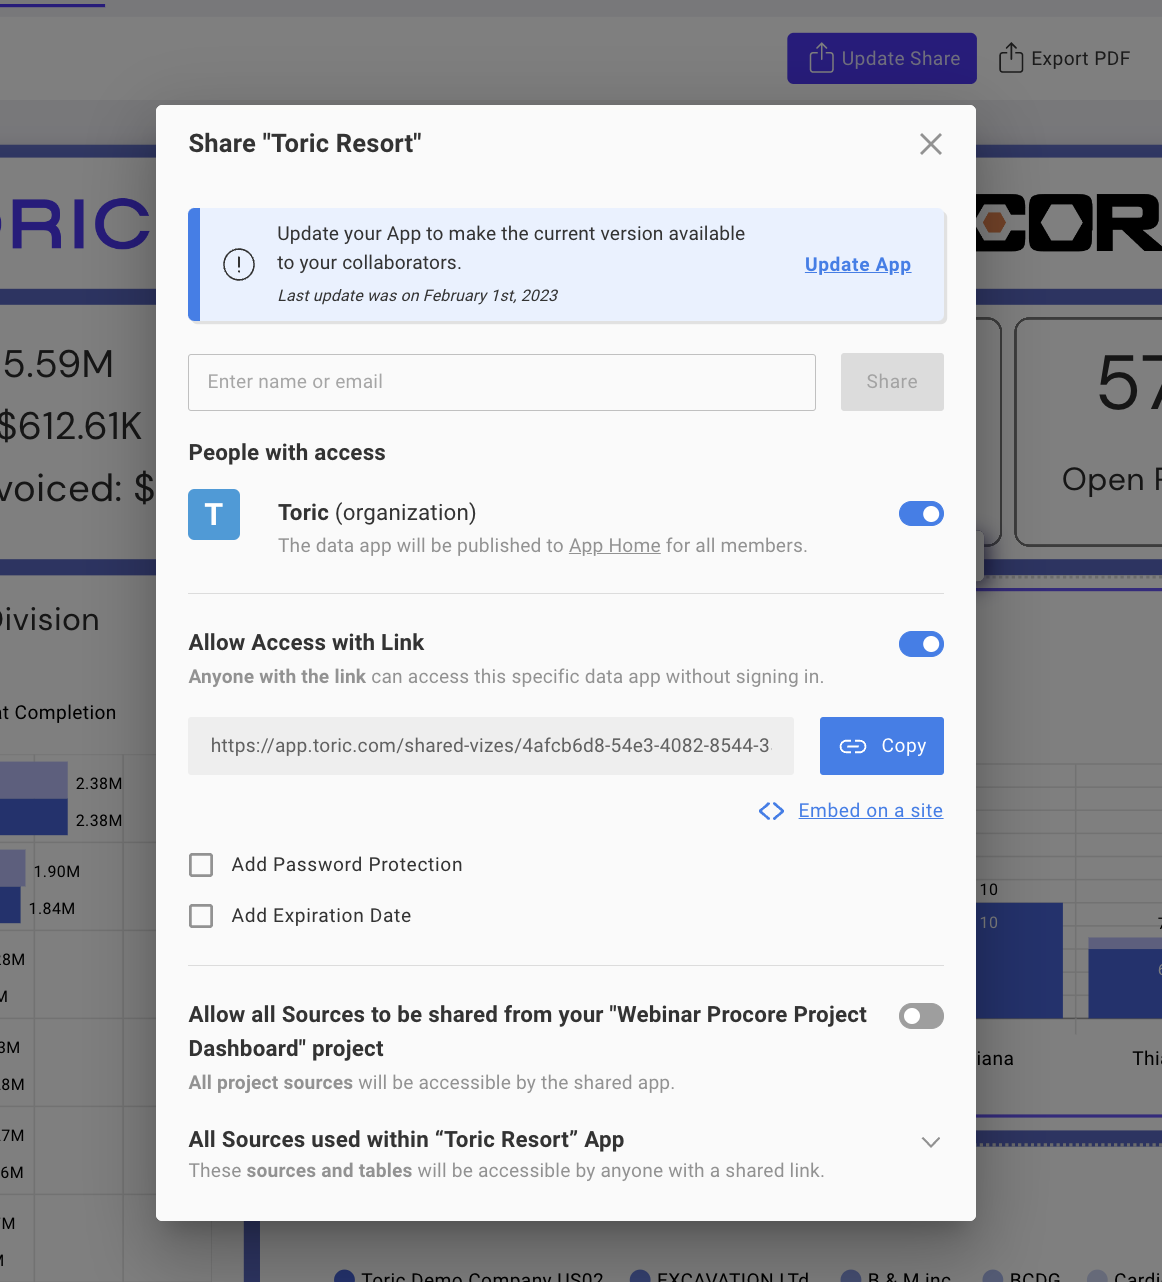 Data Visualization: Sharing security
We’ve made changes to our columns node that improve how it functions. When you select a column node, you now have the ability to control column visibility, freeze columns, or reorder columns:
Control visibility. Choose whether you want it visible or not. If you disable visibility of a column, it still exists in the table and you can still work with the column, but when you’re visualizing the table, the column will not appear.
Freeze columns. Visually isolate specific columns when scrolling in a data table. Select the column within the node that you would like to freeze and once selected, the column and click freeze, this column will now become a static column.
If you scroll in this data table with the freeze column feature, this column will continue to stay on the left hand side and will remain there, regardless of how far you scroll. You can also freeze two columns at once, and reorder the sequence of columns in your table within the columns node.
Reorder columns. Within the columns node, drag the columns in the order you would like them to appear in your table.
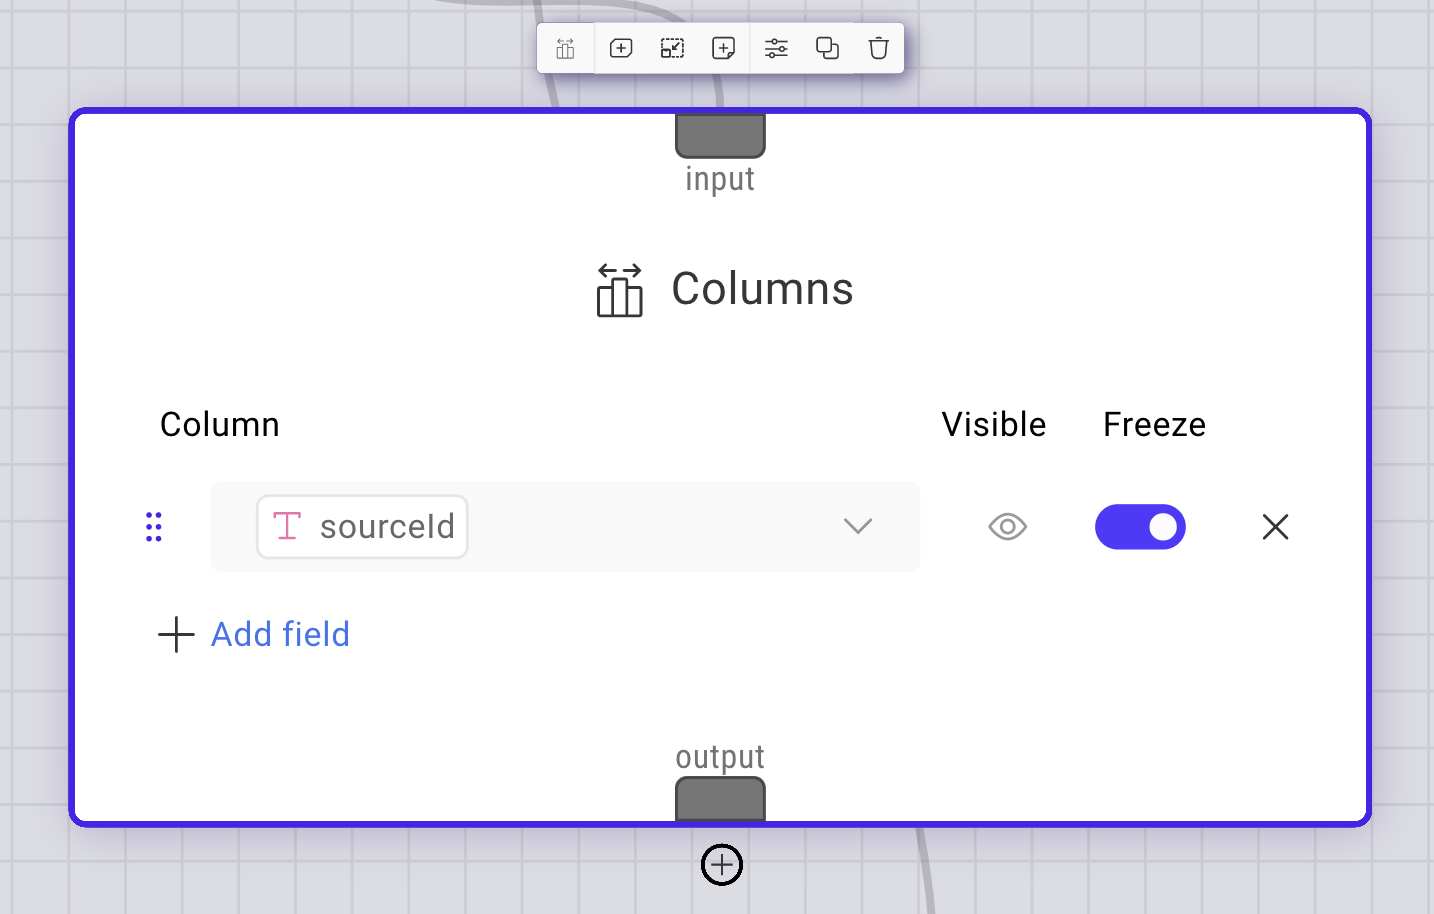 Columns Node-Freeze Reorder Visibility
Using legends within charts can be a simple tool to provide the context and information needed to make your dashboards or reports easier to understand. Y
Manage visibility easily. Control which elements are shown within your chart using the visibility toggle.
Control legend formatting. Customize key formatting like placement, bullet styles, and overflow settings. Legend placement determines where your legend displays in relation to the chart. Bullet style defines the shape of the color coding in your chart. Overflow determines how your legend displays when the information overflows from the display frame.
 Legends in charts enhancement

