🤖 Join the Waitlist to our AI Copilot for Your Data. Get Early Access
Use a constant value (ie. a number) to set values in the Gauge chart. This works particularly well if you have a target for a specific KPI (i.e., profit) and you want to measure your progress against this value.

Select any visualization in a Data App and click Properties on the toolbar. Alternatively, click the Properties button on the top right of your screen.
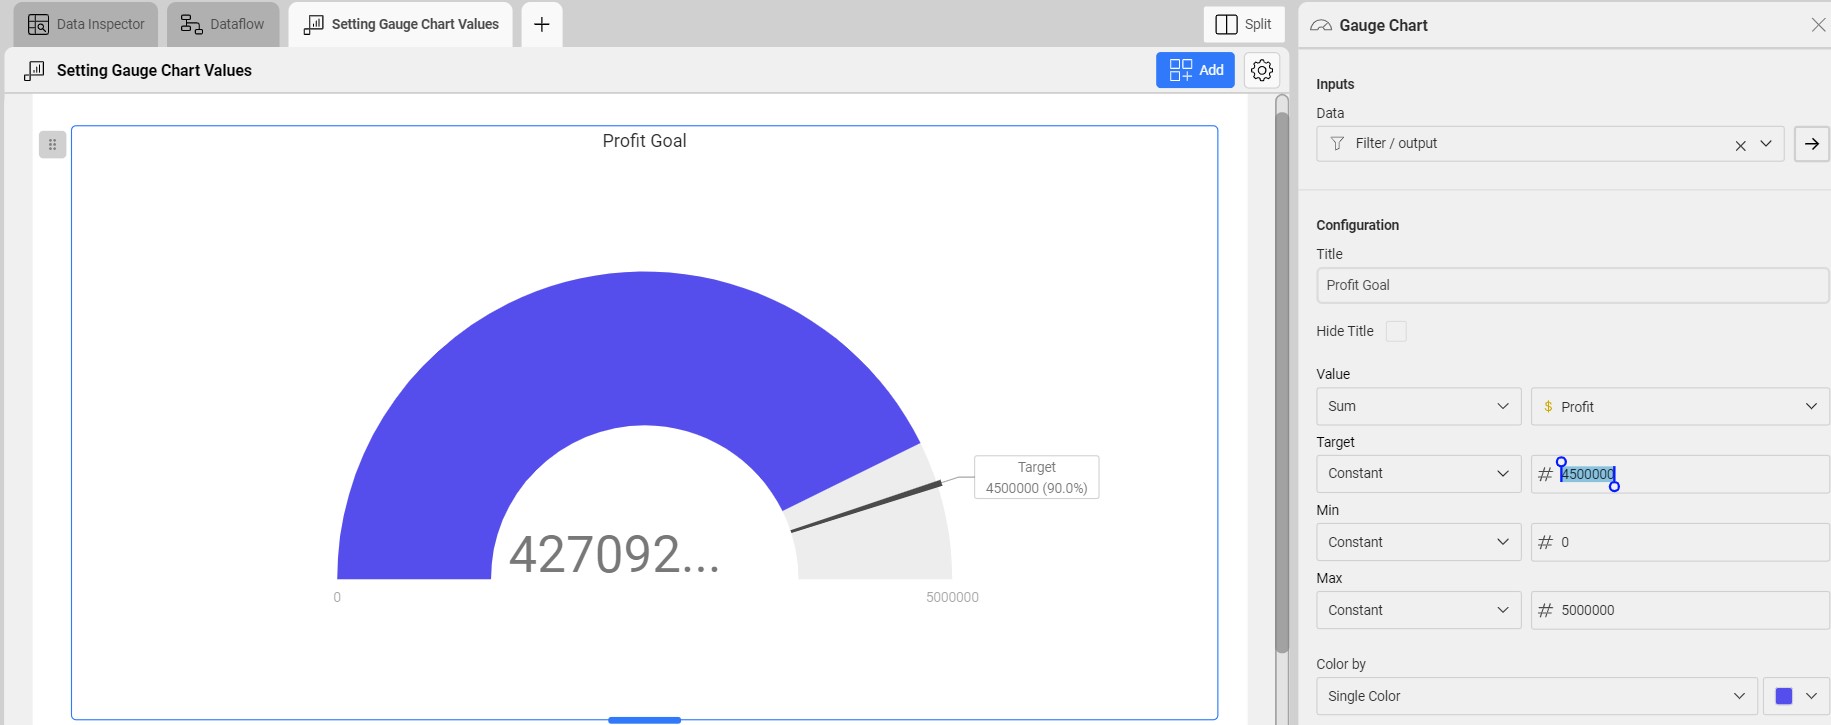
Scroll to to the Configuration section, there are four properties your could set:
First use the left dropdown and select the Constant option. Then use the text box to enter a value.
Check out more references and build your first App today.


